Curated OER
Polynomials and Linear Factors
This algebra activity reviews writing polynomials in standard form from factored form, looks at the graphs of polynomials of degree higher than two, and identifies the zeros of polynomials using the Factor Theorem and Fundamental Theorem...
Curated OER
Inequalities and Their Graphs
In this algebra activity, students identify the solution of an inequality. They graph their answers on a number line. There is an answer key to this problem.
Curated OER
Solving Inequalities with Fractional Coefficients
For this algebra worksheet, learners solve inequalities by factoring. They graph their solution on a number line. There is an answer key.
Curated OER
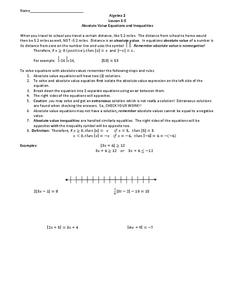
Absolute Value Equations and Inequalities
In this algebra instructional activity, students solve equations and inequalities. They graph their solution set on a number line. There are 16 questions with an answer key.
Curated OER
College Prep Algebra, Worksheet Chapter 3, 2.5, 2.7, 3.1- 3.4
In this algebra worksheet, students translate 39 word problems into algebraic terms and solve them. They complete 42 problems about coordinate graphing, working with ordered pairs, slop, and equations of lines.. They make 2 scatter grams...
Curated OER
Absolute Value Equations and Inequalities
In this Algebra II activity, 11th graders solve and graph the solutions to absolute value equations and inequalities. The two page activity provides explanation and examples in addition to sixteen practice questions. Answers are not...
Curated OER
Solving Inequalities
In this solving inequalities worksheet, 9th graders solve 15 different inequalities. First, they use the addition, subtraction, multiplication, and division properties of inequalities to solve linear inequalities. Then, students draw a...
Inside Mathematics
Coffee
There are many ways to correlate coffee to life, but in this case a worksheet looks at the price of two different sizes of coffee. It requires interpreting a graph with two unknown variables, in this case the price, and solving for those...
Virginia Department of Education
Rational Functions: Intercepts, Asymptotes, and Discontinuity
Discover different patterns by making connections between a rational function and its graph. An engaging instructional activity asks scholars to explore the behavior of different rational functions. Groups discover a connection between...
Curated OER
Narrow Corridor
Buying a new sofa? Learn how to use the Pythagorean Theorem, as well as algebra and graphing techniques, to determine whether the sofa will fit around a corner (which I'm sure you'll agree is a very important consideration!).
Concord Consortium
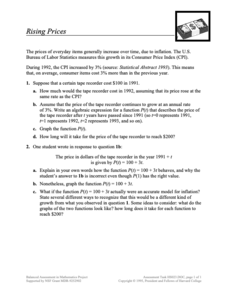
Rising Prices
What will that cost in the future? The scenario provides pupils with a growth as a Consumer Price Index. Learners create functions for a given item to determine future prices and graph them. Class members then compare their functions to...
Inside Mathematics
Quadratic (2006)
Most problems can be solved using more than one method. A worksheet includes just nine questions but many more ways to solve each. Scholars must graph, solve, and justify quadratic problems.
Curated OER
Two Step Inequalities
In this algebra worksheet, 11th graders solve two step algebraic inequalities and graph their solution on a number line. This worksheet contains 20 graphing problems with an answer key.
Curated OER
Solving Systems of Inequalities
In this algebra worksheet, students solve systems of inequality using the graphing method. There are 5 questions with lots of examples and an answer key.
Curated OER
Absolute Value Inequalities
In this algebra worksheet,students solve inequality equations and graph their answers on a number line. There are 22 questions with an answer key.
Curated OER
Solving Inequalities
In this algebra worksheet, students solve inequality equations and graph them on the number line. There are 22 questions with an answer key.
Curated OER
Chapter 2 Practice Test
In this algebra worksheet, students examine and graph linear equation, inequalities, and absolute value inequalities in two variables. The three page worksheet contains forty-six problems. Answers are not included.
Illustrative Mathematics
Peaches and Plums
According to the resource graph, which costs more: peaches or plums? Algebra learners compare two proportional relationships and then throw in a banana. Leaving out the scale helps students become intuitive about graphing.
Inside Mathematics
Population
Population density, it is not all that it is plotted to be. Pupils analyze a scatter plot of population versus area for some of the states in the US. The class members respond to eight questions about the graph, specific points and...
Curated OER
SOL Review
For this SOL worksheet, students solve inequalities, identify equivalent fractions and graph polynomial functions. They find the geometric means and compute average rates. This eight-page worksheet contains 20 multiple-choice problems.
Curated OER
Inequality Shading Investigation
In this inequality worksheet, students graph the inequality of a line. They list ten integer coordinates that lie on the grid. Students explore their findings and answer thought questions. They shade the graph to indicate answers. ...
Curated OER
Analyzing Graphs
For this statistics and probability worksheet, students analyze frequency distribution tables or histograms and box and whisker plots. The two page worksheet contains four multiple choice questions. Answers are included.
Curated OER
Graphing Linear Inequalities
In this algebra worksheet, students graph inequality linear graphs and shade using a test point. There are 14 problems with an answer key.
Curated OER
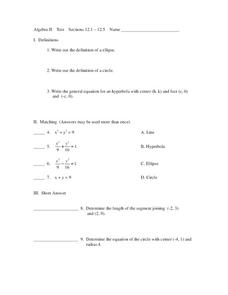
Conics and Graphing
In this algebra worksheet, students solve equations by graphing an ellipse, circle and hyperbola. They match equations to graphs and define each type of function. There are 20 questions total.


