Curated OER
Discovering Ohm's Law
Connect math with science! Pupils apply properties of Ohms Law as they solve problems and identify the inverse relationship of a function. They analyze the shape of the graph of an inverse function and use it to make predictions.
National Security Agency
Sampling for a Rock Concert
Over the course of three class periods, middle schoolers design an experiment to provide learner input to administration about which rock band to invite to play at school. They practice several random sampling exercises, all well...
Curated OER
Baseball Relationships - Using Scatter Plots
Students use graphing calculators to create scatter plots of given baseball data. They also determine percentages and ratios, slope, y-intercepts, etc. all using baseball data and statistics.
Curated OER
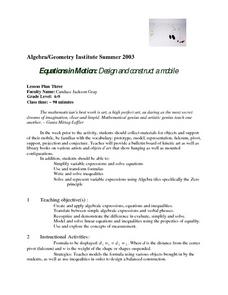
Equations in Motion: Design and construct a mobile
Students participate in a instructional activity that covers the concepts of solving equations and inequalities. To master the concept they must demonstrate visually and verbally how both sides of an equation must be balanced. They...
Curated OER
Spaghetti Graphs
Students work in pairs to test the strength of spaghetti strands. They collect and graph data to determine a line of best fit. Students create a linear equation to interpret their data. Based on the data collected, students predict...
Alabama Learning Exchange
Investigating School Safety and Slope
Learners investigate the slope of various stairways through a "news report" approach and employ mathematical knowledge of applied slope to report on wheelchair accessibility and adherence to Americans with Disabilities Act. They...
Curated OER
Woody Sine
High schoolers explore the concept of sine. In this sine lesson, students create a sine graph from tooth picks. High schoolers create a unit circle with tooth pick length radius. Students then take the tooth picks from the unit circle...
Curated OER
Equations Lesson Plan
Seventh graders play "What's my Rule" beginning with simple equations and working towards harder problems as student's gain confidence. They evaluate the equations by graphing them. Students identify the slope and y intercepts of the...
Curated OER
Less is More: Realizing Mathematics Through Agriculture
High schoolers study the architectural designs of different popular sites. In this math lesson, students draw a grid diagram. They explain what geodesic algorithms are used for.
Curated OER
How Much Does That Car Cost?
Students calculate how much it costs to buy a used car and finance it through a bank. They select a car from the newspaper, conduct Internet research on current auto loan interest information for four different states, and create a...
Curated OER
Using Excel To Teach Probability And Graphing
Students engage in the use of technology to investigate the mathematical concepts of probability and graphing. They use the skills of predicting an outcome to come up with reasonable possibilities. Students also practice using a...
Curated OER
Pythagorean Theorem Spreadsheet
Studetns use a spreadsheet to organize data on the sides of a triangle. They use the Pythagorean Theorem and the If then spreadsheet function to decide whether the three sides determine a right triangle. Students work individual...
Curated OER
Using Excel to Reference and Graph Live Data from a Web Site
Students collect live buoy data about water temperatures in the Gulf of Mexico from the Internet and work individually to organize their data and create a line graph using Excel Spreadsheet. Students analyze their data and examine any...
Curated OER
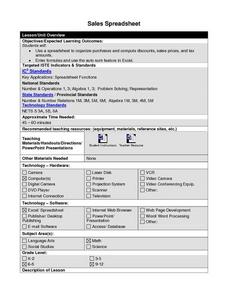
Sales Spreadsheet
Students use Excel spreadsheets to organize purchases, discounts, sales prices, and sales tax. Students follow step by step instructions and enter formulas as well as use the auto sum feature to calculate required calculations.
Alabama Learning Exchange
I'm Lovin' It: Finding Area Between Curves
Students explore the concept of finding the area between two curves. In this finding the area between two curves instructional activity, students model the logos of McDonalds, Nike, and Motorola on grid paper. Students find functions to...
Alabama Learning Exchange
Technology for Displaying Trigonometric Graph Behavior: Sine and Cosine
Young scholars explore the concept of sine and cosine. In this sine and cosine lesson, students work in groups to graph sine and cosine functions. Young scholars examine how coefficients in various parts of each parent function shift...
Alabama Learning Exchange
Cosmic Measurements
Learners develop two units of measurement to relate to the astronomical unit and the light year. In this astronomy lesson, students use a Twizzler to develop a measurement unit similar to the astronomical unit. They use a moving object,...
Curated OER
Killer Wrapper
Students examine the importance of food safety and the impact it has on their lives. In this health lesson students complete an oral report on food poisoning and design a low cost "safe" packing material for bread.
Curated OER
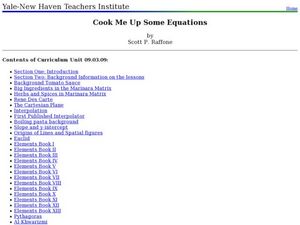
Cook Me Up Some Equations
Students study a variety of math concepts in the context of cooking up a meal. In this math lesson plan, students calculate surface area and volume. They draw and interpret different types of graphs.
Curated OER
Stressed to the Breaking Point
High schoolers explore the relationship between the amount of weight that can be supported by a spaghetti bridge, the thickness of the bridge, and the length of the bridge to determine the algebraic equation that best represents that...
Curated OER
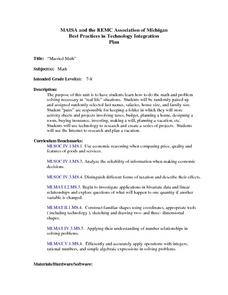
Married Math
Students participate in a two-week real-life math unit. In pairs, they calculate salaries, taxes, and a budget, plan a vacation, buy insurance, make a will, and design a room. They conduct Internet research to plan the vacation, and...
Curated OER
Who Wants to Carry a Million?
Students, in groups, determine the volume of a box large enough to hold a million dollars. They calculate the dimensions of a bill and the volume of the money.
Curated OER
First Degree Equations
Young scholars establish a solid competence in solving all types of equations and a solid understanding of how variables and equations can be utilitzed to solve real life problems.
Curated OER
Forces and Graphing
Young scholars analyze graphs to determine relationships between variables and rates of change. They determine the basic concepts about static reaction forces. They determine the slope and equation of a line.
Other popular searches
- High School Algebra Projects
- Pre Algebra Projects
- Hands on Algebra Projects
- Algebra Projects on Slope
- Algebra Projects Factoring
- Pre Algebra Projects
- Algebra Projects Quadratics
- Algebra Projects Rating=3
- Algebra Projects Foil
- Algebra Projects Linear Job
- Prue Algebra Projects
- Prue Algebra Projects


