Texas Instruments
TI-Nspire™ CAS
When it comes to rating educational calculators, this calculator is always near the top of this list. Now it's available as an app. There is a lot of calculator power wrapped up in this app. Not only is this a fully functioning...
Curated OER
Line of Best Fit
High schoolers explore the concept of linear regression. In this linear regression lesson, students do a Barbie bungee activity where they collect linear data. High schoolers plot their data using a scatter plot. Students determine a...
Curated OER
Algebra II: Quadratic Functions
Students collect and organize data, make a scatterplot, fit a curve to the appropriate parent function, and interpret the results. Students translate among the various representations of the quadratic function, formulate equations, use a...
EngageNY
Modeling Relationships with a Line
What linear equation will fit this data, and how close is it? Through discussion and partner work, young mathematicians learn the procedure to determine a regression line in order to make predictions from the data.
Curated OER
Properties of Logarithms
Students explore the concept of logarithms. For this logarithms lesson, students graph logarithms on their Ti-Nspire calculator. Students describe the shapes of their graphs by identifying slope, y-intercepts, and roots. Students...
Curated OER
Curve Fitting and the TI-85 Calculator
Seventh graders follow a step-by-step guide for using graphing calculator to determine equations which best fit data graphed. They gather data from various sites on the web, or they do searches to find information necessary to complete...
Curated OER
Strike a Pose: Modeling in the Real World (There's Nothing to It!)
Adjust this instructional activity to fit either beginning or more advanced learners. Build a scatter plot, determine appropriate model (linear, quadratic, exponential), and then extend to evaluate the model with residuals. This problem...
Curated OER
The Price is Right
Students, through various activities, explore online databases. Using the internet, students explore the distributors websites. They collect specific information on selected products. An spreadsheet with price comparisons is developed....
EngageNY
Determining the Equation of a Line Fit to Data
What makes a good best-fit line? In the 10th part of a 16-part module, scholars learn how to analyze trend lines to choose the best fit, and to write equations for best-fit lines to make predictions.
Mathematics Vision Project
Module 6: Congruence, Construction, and Proof
Trace the links between a variety of math concepts in this far-reaching unit. Ideas that seem very different on the outset (like the distance formula and rigid transformations) come together in very natural and logical ways. This unit...
Curated OER
Academic Grade 9 Assessment of Mathematics: Algebra I and Geometry
Test your class, or use this 12 page math packet as chapter review. They solve 21 multiple choice problems which require them to graph linear equations, find the volume of prisms and cones, find unknown angles, and determine...
Curated OER
Lines of Fit
Young scholars graph an equation and analyze the data. In this algebra lesson, students graph scatter plots and identify the line of best fit using positive correlation, negative correlation an d no correlation. They apply their data...
Curated OER
Geometric Sequences and Series
Learners find common ratios of geometric sequences on a spreadsheet. Using this data, they create scatter plots of the sequences to determine how each curve is related to the value of the common ratio. They will consider whether series...
Curated OER
Rhinos and M&M's
Students analyze patterns of exponential models by collecting data in paper folding and M&M investigations. They use graphing calculators to create scatter plots that lead to equations for the exponential models. They then apply this...
Curated OER
Sequence Investigation
Eleventh graders investigate arithmetic sequences. In this Algebra II lesson, 11th graders create an arithmetic sequence and explore the effect of each variable in the formula of the nth term of an arithmetic sequence. Students graph...
Curated OER
Lines of Fit
Students graph an equation and analyze the data. In this algebra instructional activity, students graph scatter plots and identify the line of best fit using positive correlation, negative correlation an d no correlation. They apply...
EngageNY
Interpreting Residuals from a Line
What does an animal's gestation period have to do with its longevity? Use residuals to determine the prediction errors based upon a least-square regression line. This second lesson on residuals shows how to use residuals to create a...
Curriculum Corner
8th Grade Math "I Can" Statement Posters
Clarify the Common Core standards for your eighth grade mathematicians with this series of classroom displays. By rewriting each standard as an achievable "I can" statement, these posters give students clear goals to work toward...
Radford University
A Change in the Weather
Explore the power of mathematics through this two-week statistics unit. Pupils learn about several climate-related issues and complete surveys that communicate their perceptions. They graph both univariate and bivariate data and use...
PBL Pathways
College Costs
Predict the year that college costs will double in your state using linear modeling. The first part of this two-part project based learning activity asks young mathematicians to use data from the College Board. They graph the data, write...
Curated OER
The Graduation Dilemma
Ninth graders explore data analysis. For this Algebra I lesson, 9th graders collect and organize data to create a scatter plot. Students use the regression feature of the calculator to find the line of best fit and use the equation to...
Curated OER
Test On Analytic Geometry/ Play Green Globs
Students engage in a lesson plan that focuses on analytic geometry. The lesson plan asked them to apply skills of relating equations when plotting them on the coordinate plane. Students construct the equations using specific criteria and...
Curated OER
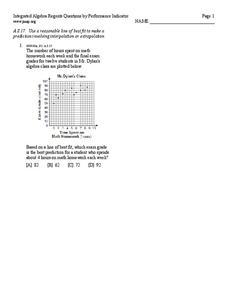
Line of best fit
In this Algebra I/Algebra II worksheet, students determine the line of best fit for a scatter plot and use the information to make predictions involving interpolation or extrapolation. The one page worksheet contains one multiple choice...
Curated OER
Geometric Sequences and Series
Learn to calculate the nth term of a sequence defined by an algebraic expression. They examine geometric sequences and series, relate geometric sequences to their explicit forms, find the partial sums of a sequence in a table, and...
Other popular searches
- Pre Algebra/ Scatter Plots
- Prue Algebra/ Scatter Plots
- Pr Algebra/ Scatter Plots
- Prue Algebra Scatter Plots


