Math Planet
Math Planet: Scatter Plots and Linear Models
Provides examples and a video lesson that explains scatter plots.
Texas Instruments
Texas Instruments: Mc Dougal Littell Algebra 1: Graphing a Scatter Plot
Students will make a scatter plot and explore any patterns.
Mangahigh
Mangahigh: Data: Scatter Plots
This site provides students practice with the concept of scatter plots. Students can learn about the topic by completing an interactive tutorial. Students can then take a ten question timed test to practice the skill.
CK-12 Foundation
Ck 12: Algebra: Applications of Function Models
[Free Registration/Login may be required to access all resource tools.] In this lesson students draw a scatter plot of data, find and draw the function that best fits that data, and make predictions from that information. Students watch...
Varsity Tutors
Varsity Tutors: Hotmath: Algebra Review: Scatter Plots
Find a quick, concise explanation of what a scatter plot is. Several examples are given and clearly explained.
Texas Instruments
Texas Instruments: Glencoe Algebra 1: Graphing Calculator Investigation Curve
Students will make scatter plots and find the appropriate regression equations that best fit the data.
CK-12 Foundation
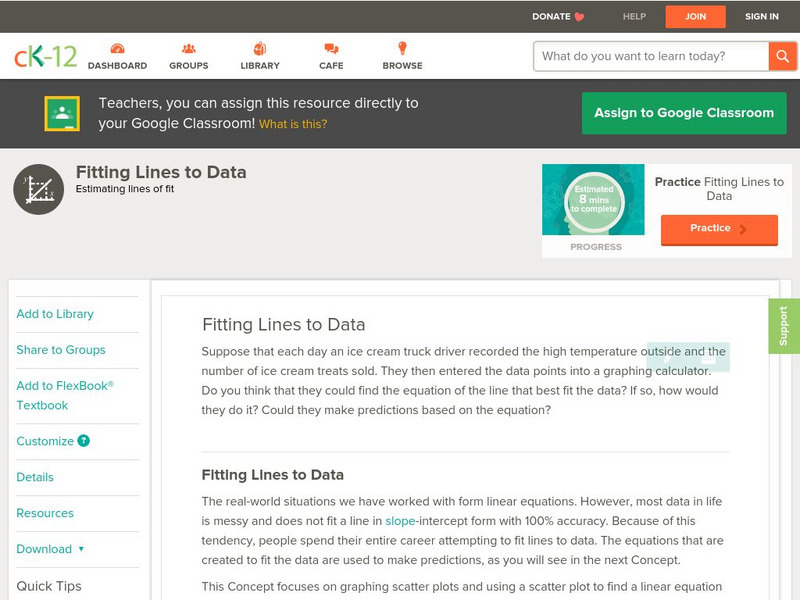
Ck 12: Algebra: Fitting Lines to Data
[Free Registration/Login may be required to access all resource tools.] Make a scatter plot of data and find the line of best fit to represent that data.
University of South Florida
Florida Center for Instructional Tech: Famous People
Students estimate the ages of famous people, then create a scatterplot with the actual ages. This activity allows them to estimate with linear equations. You can access the age data through the "activity" link.
Texas Instruments
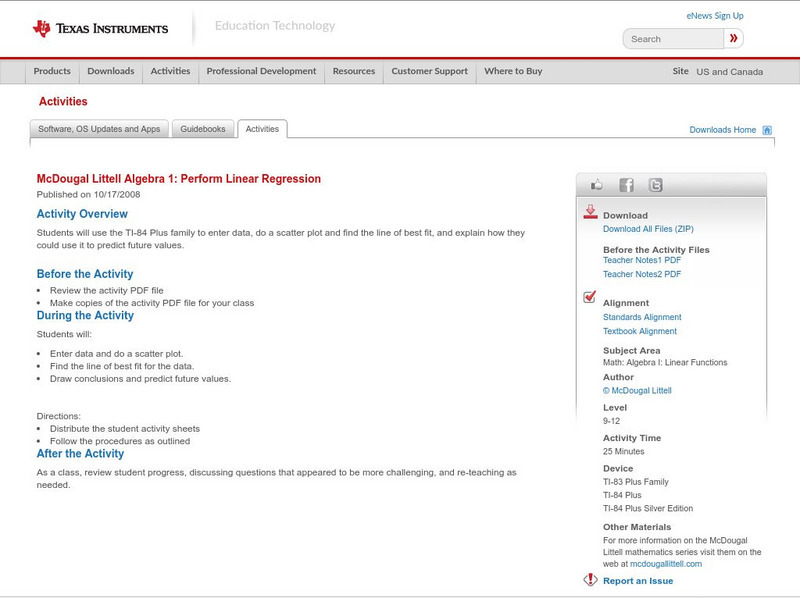
Texas Instruments: Mc Dougal Littell Algebra 1: Perform Linear Regression
Students can use the TI-84 Plus family to enter data, do a scatter plot and find the line of best fit and explain how they could use it to predict future values.
Varsity Tutors
Varsity Tutors: Hotmath: Algebra Review: Line Plot
Find a quick, concise explanation of a line plot. An example is given and clearly explained.
Alabama Learning Exchange
Alex: My Peanut Butter Is Better Than Yours!
The students will engage in the process of statistical data comparing data using tables and scatterplots. The students will compare data using measures of center (mean and median) and measures of spread (range). This lesson plan can be...
CK-12 Foundation
Ck 12: Algebra: Factoring When the Leading Coefficient Equals 1
[Free Registration/Login may be required to access all resource tools.] This lesson covers factoring quadratics when the leading coefficient is 1.
CK-12 Foundation
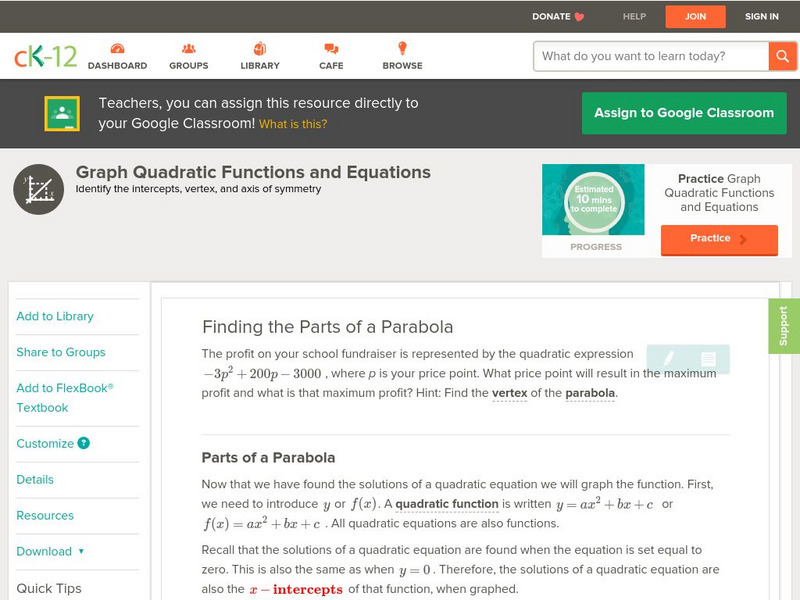
Ck 12: Algebra: Quadratic Functions and Their Graphs
[Free Registration/Login may be required to access all resource tools.] Learn the anatomy of the graph of a quadratic function.
CK-12 Foundation
Ck 12: Algebra: Fitting Lines to Data
[Free Registration/Login may be required to access all resource tools.] Learn how to write equations of best fit lines.
Richland Community College
Richland Community College: Math 116 Lecture Notes
This site from the Richland Community College provides the detailed lecture notes to a college algebra course, complete with equations and definitions. Content ranges from "functions and their graphs" to "conics and parametric equations."
Oswego City School District
Regents Exam Prep Center: Categorizing Data
Three lessons on different types of data (qualitative, quantitative, univariate, bivariate, biased data) as well as a practice activity and teacher resource.
PBS
Pbs Teachers: Weather: Rainfall
Create and use scatterplots based on information from a table, and compare and contrast annual rainfall in various places around the world.
Other
Stat Soft: Multiple Regression
This resource has a lot of information on multiple regression. It also contains information on the regression line.
Purple Math
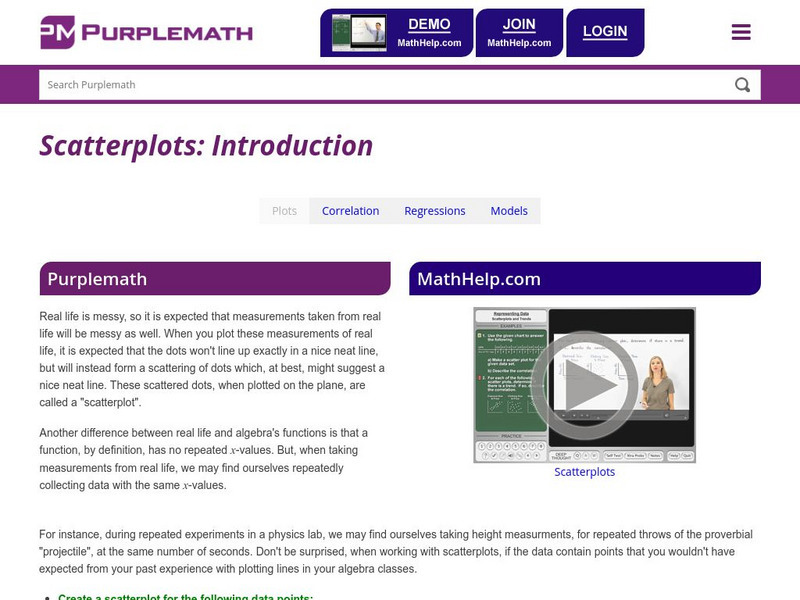
Purplemath: Scatterplots and Regressions
Explains the purpose of scatterplots, and demonstrates how to draw them.
Alabama Learning Exchange
Alex: Ballistic Statistics!
Students will collect examples of various statistical instruments and form an electronic scrapbook. These materials will be gathered from electronic sources in addition to periodicals and other print resources.
Alabama Learning Exchange
Alex: Statistically Thinking
The object of this project is for students to learn how to find univariate and bivariate statistics for sets of data. Also, the students will be able to determine if two sets of data are linearly correlated and to what degree. The...
Rice University
Rice University: The Hand Squeeze
Students will enjoy this data collection and class analysis experiment involving the time it takes for a hand squeeze to travel around a circle of people. From organizing the activity to collecting the data to making a table and graphing...
Other popular searches
- Pre Algebra/ Scatter Plots
- Prue Algebra/ Scatter Plots
- Pr Algebra/ Scatter Plots
- Prue Algebra Scatter Plots


