Curated OER
Graphing Inequalities
Students solve inequalities and graph. In this algebra lesson plan, students rewrite inequalities in the slope intercept form and graph using the slope and intercept. They shade the correct side of the line using greater than or less...
Curated OER
Multiplying Monomials
Students differentiate between linear and quadratic functions. In this algebra lesson, students write equations of graphs and graph a function from an equation. They also identify the slope and y-intercept.
Curated OER
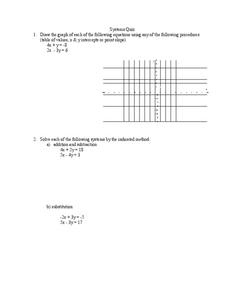
Systems of Equations
In this algebra worksheet, students solve systems of equation through graphing, linear combination and substitution. There are 3 questions.
Curated OER
Basic Equations
Ninth graders solve basic equations. In this algebra instructional activity, 9th graders solve linear equation using addition, subtraction, multiplication and division. They solve two step equations isolating the variable and putting the...
Curated OER
Points as solutions
Ninth graders graph linear functions using coordinate points. In this algebra lesson, 9th graders plot points and graph a line. They use the slope intercept form to graph their equation and evaluate points as solution to the function.
Curated OER
Graph a Situation Without a Table
Students graph an equation without a table. In this algebra lesson, students are given rate or time and asked to graph a line at the starting rate. They use the slope intercept form to decipher the word problem and graph the line.
Curated OER
Graphing Standard Form Inequality
Learners solve equations and graph it. In this algebra lesson, students solve inequalities and rewrite them in the slope intercept form. They graph the boundary lines first either as dashed or solid and shade the correct side of the line.
Curated OER
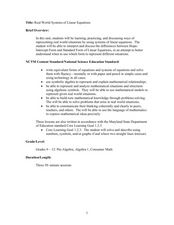
Real World Systems of Linear Equations
Students solve systems of equations with fluency. For this algebra lesson, students graph, use elimination and substitution to solve systems of equations. They identify the point of intersection using algebra.
Curated OER
Algebra 1
Students study the functional relationships of a variety of problems. In this functional relationship lesson, students determine the dependent and independent quantities of a given set of data. Students record the data and write it in...
Curated OER
Linear and Exponential Functions
This comprehensive unit on linear and exponential functions provides numerous clearly-written worksheets. Topics include graphing linear equations, solving systems of equations algebraically and by graphing, identifying the domain and...
Curated OER
Practice Graphing y = mx + b
Ninth graders graph linear equations of the form y= mx + b. In this algebra instructional activity, 9th graders are able to graph a line given the slope and y-intercept. They can write the equations of a line given the graph of a line...
BW Walch
Solving Systems of Linear Equations
Solving systems of equations underpins much of advanced algebra, especially linear algebra. Developing an intuition for the kinds and descriptions of solutions is key for success in those later courses. This intuition is exactly what...
Curated OER
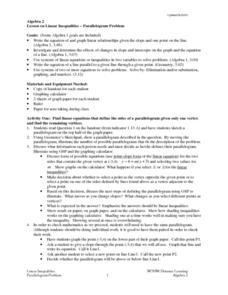
Linear Inequalities - Parallelogram Problem
Students use the Geometer's Sketchpad to illustrate possible answers to a parallelogram problem. As a class, they discuss the point-slope and linear equation forms. Individually, students solve their equations and check the results on...
Curated OER
Graphing Linear Equations on the TI
Students graph linear equations on the TI calculator. In this algebra lesson plan, students rewrite equations in the slope intercept form and use the calculator to graph their problem. They work together to interpret the graphs off of...
Curated OER
Basic Algebra and Computers: Spreadsheets, Charts, and Simple Line Graphs
Students, while in the computer lab, assess how to use Microsoft Excel as a "graphing calculator." They view visual representations of line graphs in a Cartesian plane while incorporating basic skills for using Excel productively.
Curated OER
Find Equation of Straight Line
In this algebra activity, 9th graders are given the slope and y-intercept and asked to find the equation of a line. There are 7 questions with an answer key.
Curated OER
Graphing at all Levels: It's a Beautiful Thing!
Mixing math and art is done in this lesson by applying graphing knowledge to create a unique piece of art. This lesson varies acording to the graphing knowledge of the artist. First, learners identify and review various types of graphing...
Curated OER
EOC Review G
In this end of course review, students factor expressions, interpret statistic problems, and identify the maximum and minimum of equations. This two-page worksheet contains 5 multi-step problems.
Curated OER
Mr. Payne Word Search Puzzle
In this language arts worksheet, students study 10 words in a word bank, then locate them in a word search puzzle. The words appear to be related to algebra; the meaning of the title is not known. There is one misspelled word in the word...
5280 Math
More or Less the Same
Tell the story of the math. Given a graph of a linear system, learners write a story that models the graph before crafting the corresponding functions. Graphs intersect at an estimated point, allowing for different variations in the...
Curated OER
Compound Inequalities and Graphing
Put geometry skills to the test! Learners solve compound inequalities and then graph the inequalities on a coordinate plane using their geometric skills. They identify the slope and y-intercept in order to graph correctly. I like this...
Alaska Department of Education
Mathematics Reference Sheet
Triangles and prisms don't stand a chance when your learners use this handout full of the formulas they need to know about the different shapes. Area, volume, and surface formulas are all covered along with the standard measurement and...
Curated OER
What Functions do Two Graph Points Determine?
Your algebra learners write linear, exponential, and quadratic equations containing the same two graph points in this collaborative task.
Curated OER
Graphing Inequalities and Shading
Students graph and shade inequalities. In this algebra lesson, students graph inequalities using the slope-intercept form. They shade the side of the line that is the solution and identify the domain and range.


