Curated OER
Cannonball
Students calculate the speed, motion and distance of a projectile. In this geometry lesson plan, students obtain measurements while calculating velocity. They graph their results and make predictions.
Curated OER
Does Music Cam the Savage Beast?
Students collect, graph and analyze data. In this statistics lesson, students measure the heart beat of a person as they listen to music. They use the CBL and TI to create a graph, analyzing the outcome.
Curated OER
Rise Over Run
High schoolers define the slope of the line, find the slope between any two points on the line, and allow them to name other areas where the slope is used. They explain why the slope is defined as the rise over the run.
EngageNY
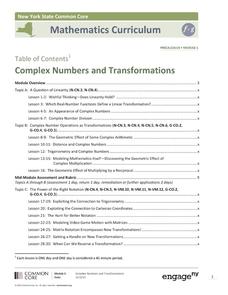
Complex Numbers and Transformations
Your learners combine their knowledge of real and imaginary numbers and matrices in an activity containing thirty lessons, two assessments (mid-module and end module), and their corresponding rubrics. Centered on complex numbers and...
Alabama Learning Exchange
Classifying Complex Numbers
Imaginary numbers are a real thing. Scholars learn about complex numbers, real numbers, and imaginary numbers. They classify given numbers as strictly complex, strictly real, or strictly imaginary in an individual or group activity.
Curated OER
Graphing Inequalities in Two Variables
This study guide is a great resource to help you present the steps to graphing linear inequalities. Show your class two different ways to graph an inequality and work on a real-world example together. The document could also be easily...
Curated OER
Inquiry Unit: Modeling Maximums and Minimums
Young mathematicians explore the maximun area for patio with the added complexity of finding the mimimum cost for construction. First, they maximize the area of a yard given a limited amount of fence and plot width v. area on a...
Teach Engineering
Introduction to Circuits and Ohm's Law
Take a very basic understanding of circuits and develop a strong understanding of the parts and function of a circuit. This activity is developed to be an independent exploration of circuits from the basics to series and parallel models....
Alabama Learning Exchange
Imaginary Numbers? What Do You Mean Imaginary?
Don't worry, this resource actually exists. Scholars learn about imaginary numbers and work on problems simplifying square roots of negative numbers. As an extension, they research the history of imaginary numbers.
Curated OER
Exploring Geometric Figures
Tenth graders explore mathematics by participating in hands-on daily activities. Learners identify a list of different shapes and classify them by shape, size, sides and vertices. They utilize tangrams and geometric pieces to gain...
Alabama Learning Exchange
Float or Sink?
Experiment with mass and density as scholars figure out what makes things float or sink. First, they watch a podcast introducing these concepts. Be sure to use the comprehension question to test their understanding. Young scientists...
University of Colorado
Distance = Rate x Time
Every year, the moon moves 3.8 cm farther from Earth. In the 11th part of 22, classes use the distance formula. They determine the distance to the moon based upon given data and then graph Galileo spacecraft data to determine its movement.
Project Maths
Complex Number Operations
What do animated videos have to do with mathematics? Using operations of complex numbers and their representations on the complex plane, high schoolers observe how mathematics could be used to move animations. The lesson...
Space Awareness
Valleys Deep and Mountains High
Sometimes the best view is from the farthest distance. Satellite imaging makes it possible to create altitude maps from far above the earth. A three-part activity has your young scientists play the role of the satellite and then use...
University of Nottingham
Drawing to Scale: A Garden
See how design and geometry go hand in hand. The activity asks learners to use geometry to design a backyard garden given dimensions of each feature. Scholars work with ratios and scale to develop an accurate scale drawing that includes...
Curated OER
Linear Inequalities in Two Variables
Use this worksheet as a warm up, a refresher exercise, or a practice after a more detailed lesson on graphing linear inequalities in two variables. Start with boundaries that are horizontal or vertical, then move into graphs with...
Curated OER
Solving Absolute Value Inequalities
Start this activity with a brief description of how to solve absolute value inequalities. A space is provided to help classify the inequalities into types (greater than, less than, or equal to) and for learners to show how to graph their...
Alabama Learning Exchange
Fortune Properties
Complete identity and equality property problems in hands-on activities. Smart cookies identify the identity and equality properties. They complete a review of order of operations, watch an online video, and make a foldable with the...
Curated OER
Impossible Graphs
Students practice plotting functions on the Cartesian coordinate plane while participating in a discussion about the Possible Or Not worksheet/activity. Students also use the Impossible Graphs worksheet to practice reading a graph,...
Alabama Learning Exchange
As If Numbers Weren't Complex Enough Already!
The class explores the concept of complex numbers on a website to generate their own Mandelbrot sets. They will practice performing operations with complex numbers and then to get a visual understanding, graph the absolute value of a...
Curated OER
Maps and Modes, Finding a Mean Home on the Range
Fifth graders investigate data from maps to solve problems. In this data lesson, 5th graders study maps and collect data from each map. Students present their data in a variety of ways and calculate the mode, mean, median, and range.
Curated OER
Who is on that Bill? Alexander Hamilton and the Federalist Papers
Students, who are adult learners, participate in an Internet scavenger hunt in order to assimilate information about the biography of Alexander Hamilton and the Federalist Papers. They look at the Federalist and Anti-Federalist Papers...
Curated OER
How Alike Are We?
Fourth graders find the range, mode, median, and mean for each of the data sets (height and shoe size). They discuss which measure of central tendency for each data set best represents the class and why. Students graph the shoe size and...
Curated OER
Substitution and Elimination
In this substitution and elimination instructional activity, students complete short answer problems for substitution and elimination and read notes about them as well. Students complete 13 problems.


