Curated OER
Using Data Analysis to Review Linear Functions
Using either data provided or data that has been collected, young mathematicians graph linear functions to best fit their scatterplot. They also analyze their data and make predicitons based on the data. This lesson is intended as a...
Curated OER
Inequalities 7.3
Graph inequalities and discuss the difference in their slopes. Learners observe rate of change as they compare linear, quadratic, and cubic functions.
Curated OER
Finding Equations
Students make equations from everyday data. They create a graph from the equations. Students predict and analyze the results. Students complete the second scenario on their own and turn in their handout.
Robert Gordon University
Indices
The laws of exponents are written on a handy reference sheet. Note that since this worksheet was written in the UK, powers or exponents are also called indices (singular: index). If this does not pose a problem for you, the concepts and...
Noyce Foundation
Snail Pace
Slow and steady wins the race? In the assessment task, scholars calculate the rates at which different snails travel in order to find the fastest snail. Hopefully, your class will move much more quickly in finishing the task!
Curated OER
Conductivity of salt Solutions
Students investigate the concentration level of solutions. For this math/science lesson, students identify three different ionic compounds. They predict the conductivity of each using their collected data.
Curated OER
Equations in Motion: Design and construct a mobile
Students participate in a lesson that covers the concepts of solving equations and inequalities. To master the concept they must demonstrate visually and verbally how both sides of an equation must be balanced. They construct a balanced...
Curated OER
I want a credit card--or do I?
Students pretend to borrow $1000.00 on a credit card. They pretend to make the minimum payments for a year. When they're done, they make a pie chart showing how much of their payments reduced their debt, and how much was interest.
Curated OER
Exponents Worksheet: 2 of 2
Not the most attractive worksheet, but useful nonetheless. A chart is displayed for mathematicians to fill in the power, base number, exponent, the repeated multiplication problem, and the total value. They complete this activity for...
Curated OER
Why Would I Owe My Soul to the Company Store?
Sixth graders listen to "Sixteen Tons" by Tennessee Ernie Ford and discuss what it means to owe one's soul to a store. In this mathematics lesson, 6th graders determine what a miner's income was minus his expenses graphing findings in a...
Curated OER
Decoding Machine
Pupils are introduced to the concept of variables and their uses. In groups, they are given a code in which they must find the value of the missing words. To end the lesson, they find the value of words over ten letters long and their...
Curated OER
Rational Exponents
Investigate rational exponents in this math lesson. Scholars make conjectures about the relationship between rational exponents and radicals. They then use their Ti-Nspire to simplify rational exponents.
Virginia Department of Education
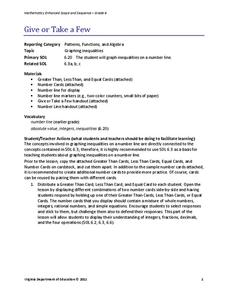
Give or Take a Few
Young mathematicians extend their knowledge of rational numbers on a number line to graph inequalities by first using number cards to compare rational numbers. They finish by using similar reasoning to graph inequalities on a number line.
Inside Mathematics
Quadratic (2009)
Functions require an input in order to get an output, which explains why the answer always has at least two parts. After only three multi-part questions, the teacher can analyze pupils' strengths and weaknesses when it comes to quadratic...
Howard County Schools
Building a Playground
Scholars crave practical application. Let them use the different models of a quadratic function to plan the size and shape of a school playground. They convert between the different forms and maximize area.
Inside Mathematics
Coffee
There are many ways to correlate coffee to life, but in this case a worksheet looks at the price of two different sizes of coffee. It requires interpreting a graph with two unknown variables, in this case the price, and solving for those...
Education Development Center
Points, Slopes, and Lines
Before graphing and finding distances, learners investigate the coordinate plane and look at patterns related to plotted points. Points are plotted and the goal is to look at the horizontal and vertical distances between coordinates and...
Education Development Center
Thinking Things Through Thoroughly
Problem solving is a skill of its own. Learners use a variety of problems to encourage mental math and logic to get the correct answer. Guiding questions are provided along the way to encourage the right way of thinking to help tackle...
Education Development Center
Logic of Fractions
Before diving into operations with fractions, learners discover the foundation of fractions and how they interact with one another. Exactly as the title says, logic of fractions is the main goal of a resource that shows pupils how...
Education Development Center
Geography of the Number Line
It's more than just numbers on a line, its an organizational, mental math machine to help learners understand the value of numbers. The tool is handy when introducing positive and negative integers to see their values and relationships....
Education Development Center
Micro-Geography of the Number Line
Young mathematicians dive into the number line to discover decimals and how the numbers infinitely get smaller in between. They click the zoom button a few times and learn that the number line doesn't just stop at integers. Includes a...
Texas Instruments
Graphs of Rational Functions
Take your kids on a tour of graphing rational functions. Using this TI lesson, high schoolers identify the end behavior of their functions. They find the domain and range, describe end behavior, and look at asymptotes and restrictions of...
Education Development Center
Geography of the Coordinate Plane
Put the graph into graphing and allow learners to understand the concept of point plotting and how it relates to data. The worksheet provides a nice way to connect data analysis to a graph and make predictions. The worksheets within the...


