EngageNY
Solving Equations
Teach solving equations through an exploration of properties. Before pupils solve equations they manipulate them to produce equivalent equations. The activity switches the focus from finding a solution to applying properties correctly.
EngageNY
Margin of Error When Estimating a Population Mean (part 1)
We know that sample data varies — it's time to quantify that variability! After calculating a sample mean, pupils calculate the margin of error. They repeat the process with a greater number of sample means and compare the results.
EngageNY
Distributions—Center, Shape, and Spread
Data starts to tell a story when it takes shape. Learners describe skewed and symmetric data. They then use the graphs to estimate mean and standard deviation.
EngageNY
Interpreting the Standard Deviation
Does standard deviation work for non-symmetrical distributions, and what does it mean? Through the use of examples, high schoolers determine the standard deviation of a variety of distributions and interpret its meaning. Problems require...
EngageNY
Dividing by (x – a) and (x + a)
Patterns in math emerge from seemingly random places. Learners explore the patterns for factoring the sum and differences of perfect roots. Analyzing these patterns helps young mathematicians develop the polynomial identities.
EngageNY
The Height and Co-Height Functions of a Ferris Wheel
Show learners the power of mathematics as they model real-life designs. Pupils graph a periodic function by comparing the degree of rotation to the height of a ferris wheel.
EngageNY
Using a Curve to Model a Data Distribution
Show scholars the importance of recognizing a normal curve within a set of data. Learners analyze normal curves and calculate mean and standard deviation.
EngageNY
Sampling Variability in the Sample Proportion (part 2)
Increase your sample and increase your accuracy! Scholars complete an activity that compares sample size to variability in results. Learners realize that the greater the sample size, the smaller the range in the distribution of sample...
EngageNY
Sampling Variability in the Sample Mean (part 1)
How accurate is data collected from a sample? Learners answer this question using a simulation to model data collected from a sample population. They analyze the data to understand the variability in the results.
EngageNY
Evaluating Reports Based on Data from a Sample
Statistics can be manipulated to say what you want them to say. Teach your classes to be wise consumers and sort through the bias in those reports. Young statisticians study different statistical reports and analyze them for misleading...
West Contra Costa Unified School District
Square and Square Roots
Root for your pupils to learn about roots. Young mathematicians first review the meaning of squares and square roots. They then use this knowledge to simplify square roots of monomials with variables.
Curated OER
Simultaneous Equations
In this simultaneous equations learning exercise, pupils solve systems of equations. They graph systems of equations and write equations to fit given situations. This two-page learning exercise contains three multi-step problems.
West Contra Costa Unified School District
Conics Introduction and Parabolas
Where did conic sections get their name? The equation and graph of a parabola are developed from the definition of the conic section. Teacher examples on graphing the equation and writing an equation from the graph round out the plan.
West Contra Costa Unified School District
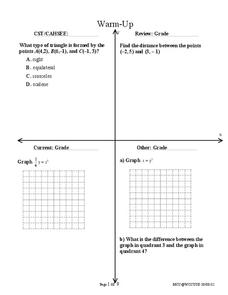
Talking About Distance, Rate and Time
Connect the tortoise and the hare fable to mathematics. Learners first identify key terms related to distance, rate, and time. They then solve distance/rate/time problems using different representations.
West Contra Costa Unified School District
Geometric Sequences
Place a lesson on sequences in your sequence of lessons. Scholars first learn the basics of geometric sequences, such as common ratios and then they write recursive and explicit formulas for geometric sequences.
Chapman University
Point-Slope Formula for a Straight Line
Single-page poster showing the point-slope formula and its graph. Put this up on the wall of your math room or use as a handout. This clearly displayed graph and algebraic explanation will get your charges thinking about what is it...
Curated OER
Pedal Power
Employ proportional reasoning and algebraic understanding to a determine a real world math quandary. Intel has created a project based unit to engage learners in using algebra to describe the physical world. They will create equations,...
Curated OER
Working With Equations
High schoolers create a mathematical formula to help plan ration supplies for a polar expedition. Using basic algebra skills, students identify the variables in planning for rations. They create an equation to help plan the expedition....
Virginia Department of Education
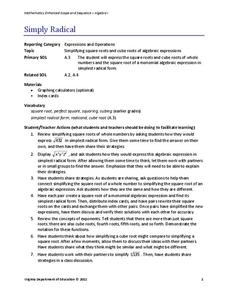
Simply Radical
Simplifying is radical, dude! After reviewing how to simplify square roots of whole numbers, scholars consider how to simplify square roots of algebraic monomials. Also taken under consideration is how to simplify cube roots of whole...
Curated OER
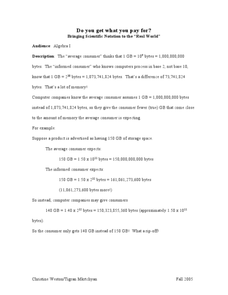
Do You Get What You Pay For?
Consumers explore scientific notation as it relates to the real world. In this algebra lesson, mathematicians convert Gigabytes in to scientific notation to see if they are being cheated. They differentiate between base ten and base of...
Curated OER
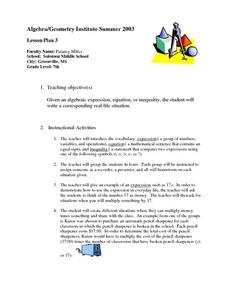
Real Life Situations
Pupils investigate different equations and think critically how they could represent a real-life situation. They should write a word problem to coincide with the given equations. The lesson requires students to use critical thinking skills.
Curated OER
Rational Exponents
In this Algebra worksheet, students simplify expressions involving rational exponents. The one page worksheet contains explanation, examples and nine practice problems.
Curated OER
Understanding Variables
Students solve linear equations and identify the unknown. In this algebra lesson, students define a variable and use addition, subtraction, multiplication and division to solve. They change the equation depending on the value of the...
Illustrative Mathematics
Watch Out for Parentheses 1
Parentheses are an important tool in the algebraic toolbox in regard to the structure of the algebraic equation. They are the beginning of the standard order of operations rule, the P in PEMDAS. The central question that 5th graders are...
Other popular searches
- Patterns Algebraic Thinking
- Algebraic Reasoning Unit
- Patterns, Algebraic Thinking
- Tiles Algebraic Thinking
- Algebraic Thinking in Music
- Algebraic Thinking Graphing
- Basic Algebraic Reasoning
- Algebraic Thinking Textbooks
- Algebraic Thinking/pattern
- Algebraic Thinking Part 2
- Algebraic Reasoning Assessment


