02 x 02 Worksheets
Inverse Variation
Discover an inverse variation pattern. A simple lesson plan design allows learners to explore a nonlinear pattern. Scholars analyze a distance, speed, and time relationship through tables and graphs. Eventually, they write an equation to...
Kent State University
How Does that Work?
Sixth and seventh graders explore algebra word problems. They work with a partner to solve word problems distributed by e-mail. Learners simplify mathematical expressions following a "think aloud" algebra strategy modeled by the teacher....
West Contra Costa Unified School District
Derivative – Standard Definition
Making a clear connection to algebra concepts helps learners understand the definition of a derivative. The lesson begins with looking at limits of simple linear and rational functions, and leads to the definition of the...
Curated OER
Linear Inequalities
Through exploration of linear programming through graphs and equations of inequalities, students relate linear programming to real life scenarios, such as business. Graphing and shading is also part of this exercise.
Illustrative Mathematics
Do Two Points Always Determine a Linear Function?
Your learners can approach this task algebraically, geometrically, or both. They analyze the building of a linear function given two points and expand the concrete approach to the abstract when they are asked to find the general form of...
Inside Mathematics
Expressions
Strive to think outside of the quadrilateral parallelogram. Worksheet includes two problems applying prior knowledge of area and perimeter to parallelograms and trapezoids. The focus is on finding and utilizing the proper formula and...
Curated OER
Introduction to the National Debt
Students relate the national debt to the economy. In this algebra lesson, students discuss what the national debt is, create a national budget based on priority and what the government should spend money on. They analyze their findings...
West Contra Costa Unified School District
Sneaking Up on Slope
Pupils determine the pattern in collinear points in order to determine the next point in a sequence. Using the definition of slope, they practice using the slope formula, and finish the activity with three different ways to...
Curated OER
Latitude
Your young geologists generate a graph given a table of values from the context of latitude and percent of the earth's surface north of that latitude. The questions in the activity then focus the learners to a deeper understanding of the...
NASA
What's the Frequency, Roy G. Biv?
While all light travels at the same speed, each color in the visible light spectrum contains a different wavelength and frequency. Scholars determine the relationship between frequency and wavelength as they complete the activity. They...
Mathematics Vision Project
Module 2: Logarithmic Functions
You can't build a fire with these logs! Filled with hands-on investigations, a complete logarithmic unit offers both instruction and practice. Learners first build an understanding of the new function, then explore properties before...
Curated OER
Geometric Sequences - Bacterial Growth
Bring algebra to life with scientific applications. Math minded individuals calculate and graph the time it takes a bacterium to double. They discuss geometric sequences and use a chart to graph their findings. There are 38...
Illustrative Mathematics
Fixing the Furnace
This comprehensive resource applies simultaneous equations to a real-life problem. Though the commentary starts with a graph, some home consumers may choose to begin with a table. A graph does aid learners to visualize the shift of one...
Curated OER
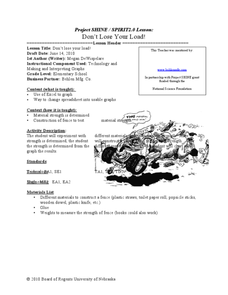
Don't Lose Your Load!
Young scholars create graphs using collected data. In this algebra lesson, students use spreadsheet in Excel to create graphs to interpret their data and make predictions. They rewrite word problems using algebraic expressions.
Curated OER
"If You Hopped Like a Frog" by David M. Schwartz
Students search for and generalize an algebraic pattern. They make and analyze a coordinate graph.
Curated OER
The 400-Meters Race
Learners collect and graph data. In this algebra lesson, students describe, interpret and analyze data. They follow a 400 meters race and plot the coordinates of the course. They graph a line to represent the data of the course.
Curated OER
The Derivative As a Function
In this derivative worksheet, students find the derivatives of given functions and graph a function. They identify the intervals which are increasing, decreasing or remain constant. This two-page worksheet contains approximately twenty...
Curated OER
Patterns, Relations, and Functions
Students investigate the patterns of different data sets of numbers. They use critical thinking skills in order to find the missing numbers in any given set. This lesson helps to develop the skill of number sense.
Curated OER
Factors
Practice factoring numbers by using graph paper, manipulatives and computer applets.
Curated OER
Impossible Graphs
Students distinguish between possible and impossible graphs of functions, and to learn why some graphs are impossible. They have practiced plotting functions on the Cartesian coordinate plane
Curated OER
Calculating & Graphing Using a Spreadsheet
Students use the lab apparatus to calculate the average velocity and average acceleration at several points and record the data. They use the spreadsheets to plot distance vs. time, velocity vs. time and acceleration vs. time graphs.
Curated OER
QwikQure Algebra
Fourth graders are introduced to the problem using a bottle of medicine. They estimate the volume of the medicine and predict the instructions on the bottle. They then think about how they might solve the problem before asking them to...
Curated OER
Algebra II: Crickets-Nature's Thermometer
Students translate functional relationships into equations to answer questions. Students answer questions using different representations of the relationships: function rules, graphs of the function, tables of values, and equations and...
Curated OER
Calculus: Graphical, Numerical, Algebraic
Students explore the interplay between the geometric and analytic information and on the use of calculus both to predict and to explain the observed local and global behavior of a function. They write a paragraph describing any...


