Curated OER
Math Investigations 2
Young mathematicians practice measuring and graphing skills while working in groups to measure objects found in the classroom. Using their measurements, they create one bar graph displaying the lengths and another displaying the widths.
Curated OER
Investigating Factors That Affect Cell Membrane Permeability
Cell membranes and the factors that affect its integrity are studied, with Beet tissue used as the model. A poster to display findings of the permeability of the membranes would clarify understanding and also allow a layer of language...
Virginia Department of Education
Atomic Structure: Periodic Table
The fifth lesson of seven in the series outlines an in-depth analysis of the periodic table. After direct instruction, pupils take turns practicing in the group before beginning independent study. The assessments include a quiz and an...
Curated OER
Butterflies, Butterflies, Butterflies
Transform your class into a butterfly museum! Research different types of butterflies, their habitat, and life cycle. Interactive components such as PowerPoint presentations, Claymation movies, and webpages add pizzaz to the museum...
Curated OER
Show Me The Money
Third graders explore the value of U.S. money. In this money lesson, 3rd graders print out pictures of money from the Internet and create play money. The students will play a game in which they display the amount of money called out by...
Curated OER
Saving Energy Through Ecological Landscape Design
Students are able to transcribe to scale the plant features of a common landscape. They determine true north and south and collect and record data on a table. Students calculate a rating for and describe a definition of insulation and...
Curated OER
Measuring Mania
Students rotate through stations in the classroom, completing different types of measurements. These measurements are placed into a spreadsheet, and a scatter plot is generated. They type an explanation of their results in correlation...
Curated OER
Hurricanes in History:
Students interpret data displayed in a graph, make inferences based on graphical data. They work in pairs or groups to interpret graphs containing historical data of hurricanes, and then answer questions that assess their understanding...
Curated OER
Math Made Easy
Students evaluate word problems. In this problem solving lesson, students are presented with word problems requiring graphing skills and students work independently to solve.
Curated OER
Environmental Graphing
Young scholars experiment with graphing. In this graphing introduction lesson plan, students complete four activities: 1) a bar graph based on class birthdays 2) an estimation graph of the raisins in raisin bread 3) another estimation...
Curated OER
Exploring Probability
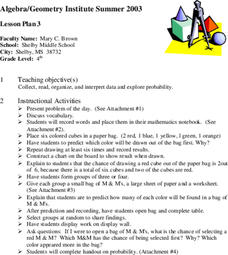
Fourth graders participate in a lesson that explores probability. They use candy and model cubes to experiment with different outcomes that can be charted if the students can proceed to the objective of the lesson. They discover how...
Curated OER
Skittles® in the Middle
Fourth graders work in small groups, using bags of Skittles?? to determine the mean of one color of Skittles?? found in each bag, in each group, and in the entire class. This is a good lesson to help motivate students to explore mode,...
Curated OER
Successful Resource-based Learning Strategies for the Geography of Canada Course
Students conduct a statistical research project on population changes. They evaluate demographic issues, such as the size and location of native people. immigrant groups, and the age and gender of the population.
University of Colorado
The Moons of Jupiter
Can you name the three planets with rings in our solar system? Everyone knows Saturn, many know Uranus, but most people are surprised to learn that Jupiter also has a ring. The third in a series of six teaches pupils what is around...
University of Colorado
Happy Landings: A Splash or a Splat?
Huygens spacecraft landed on Saturn's moon Titan in 2005, making it the farthest landing from Earth ever made by a spacecraft. In this hands-on activity, the 12th installment of 22, groups explore how density affects speed. To do this,...
Curated OER
3 Kinds of Graphs
Students construct three different graphs-a line graph, a bar graph, and a circle graph. In this graphing instructional activity, students use different graphs to display various data that they collect.
Curated OER
Probability: the Study of Chance
Students experiment to determine if a game is fair, collect data, interpret data, display data, and state and apply the rule for probability. Students use a simple game for this experiment.
Curated OER
Range and Mode
Students interpret data from graphs. In this range and mode activity, students review a tally chart, pictograph and bar graph. Students use these graphs to calculate the range and mode of each set of data.
Curated OER
Childhood Obesity
Students identify a question to generate appropriate data and predict results. They distinguish between a total population and a sample and use a variety of methods to collect and record data. Students create classifications and ranges...
Curated OER
GPS Art
Students design their own logo or picture and use a handheld GPS receiver to map it out. They write out a word or graphic on a field or playground, walk the path, and log GPS data. The results display their "art" on their GPS receiver...
Curated OER
The Nifty Fifty- Facts and Figures
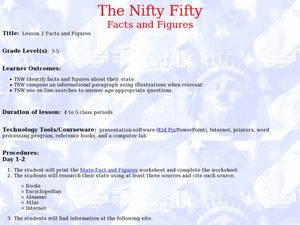
Students explore an assigned state. In this United States geography lesson, students identify facts and figures related to a particular state. Students use the Internet for research and create a PowerPoint presentation displaying these...
Curated OER
Graphing Current Drug Data
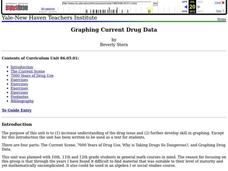
Students increase understanding of the drug issue and further develop skill in graphing.
Curated OER
Twentieth Century Entertainment: When Work is Done
Students determine how Americans enjoy leisure time. In this 20th century America lesson, students research primary sources to study how Americans gained leisure time during the century and what they did with it.
Curated OER
Ships to a New World
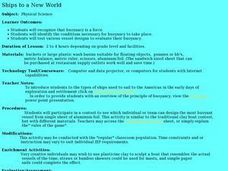
Students experiment with buoyancy as a force. In this buoyancy activity, students access an assigned website to examine the sailing vessels that came to the New World. They work as teams to build boats out of aluminum foil to see which...


