Curated OER
How Do You Spend Your Time?
Pupils keep records and determine how much time they spend on certain activities. They insert the data into a spreadsheet. Students graphically display data in a bar graph and a circle graph.
Curated OER
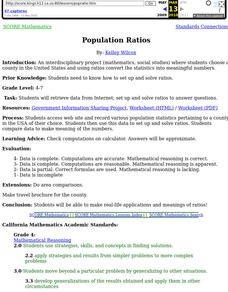
Population Ratios
Students access web site and record various population statistics pertaining to a county in the USA of their choice. They use this data to set up and solve ratios. They compare data to make meaning of the numbers.
Curated OER
M&M Graphing and Probability
Students create a variety of graphs. They count, sort, and classify M&M's by color and record data on a chart. They use data from the chart to create pictographs, bar graphs and circle graphs. They analyze data and determine...
Curated OER
Checking County Numbers
Learners use their county's information page to gather information about their community. Using the information, they create graphs from the tables provided and interpret the data. They write a paragraph showing their interpretation of...
Curated OER
Stem and Leaf Plots
In this math worksheet, students organize data into stem and leaf plots. They select the correct stem to use to organize the data. Students analyze the data on a given stem and leaf plot.
Curated OER
Discover Science
Students practice scientific research skills. In this lesson about science, students gain experience with the following skills: comparison, observation, identification, and data gathering. Students will go from station to station and...
Curated OER
How Are Students Doing on the AP exams?
Students compile and analyze data pertaining to College Credit AP Exams. They pose questions - Which exam is the easiest? - determine answers from their data and display their results.
Curated OER
Spreadsheets in Science
Fourth graders create spreadsheets, explore patterns and make predictions based on the information. They select the appropriate graph to display the spreadsheet data. They search and sort prepared data bases to gain knowledge for...
Curated OER
Heads-Up Probability
Second graders use tree diagrams to predict the possible outcomes of coin tosses. The data they collect and graph also help them predict the likelihood of getting heads or tails when tossing coins the next time.
Curated OER
Clouds and Solar Radiation
Students use satellite imaging and Mesonet solar radiation maps to answer questions given to them by the teacher and look for differences and similiarities in the data.
Curated OER
Sales Leader
Young scholars examine a set of data based on a realtor's sales for a specific amount of time. Using this information, they calculate the mean, mode and median and how to skew the data to different points of view. They determine which...
Curated OER
U.S. Leadership in World War II
Students examine the political and military leadership of the United States during World War II. Once they have assessed the qualities of leadership, they compose essays identifying specific qualities of these leaders . Using charts,...
Curated OER
Puerto Rico Pyramid Scheme
Students are introduced to the purpose of a population pyramid. In groups, they compare and contrast various population pyramids and identify trends about the civilization being examined. With a focus on Puerto Rico, they work together...
Curated OER
Plotting Wind Speed and Altitude
Students construct, read and interpret tables, charts and graphs. They draw inferences and develop convincing arguments that are based on data analysis. They create a graph displaying altitude versus wind speed.
Curated OER
Listen to Your Heart
Sixth graders explore how exercise affects heart rate and use spreadsheets to record and analyze data.
Curated OER
Charting the Heights
Students enter data regarding the height of classmates into a spreadsheet. Formulas will also be entered to find the median, mean, and mode of the data.
Curated OER
Different Perspectives of Oregon's Forest Economic Geography
Students locate the many forests located in Oregon. In groups, they use the internet to research employment data on wood products made in the state. They discuss how looking at information presented in a different way can change their...
Curated OER
How Wealthy Are Europeans?
Students investigate measures of central tendency. They examine compiled data and conduct critical analysis. The graph is focusing on the gross domestic product data. The lesson also reviews the concept of putting values in order of...
Curated OER
Math Lesson: How Many People Live There?
Students are able to calculate the population density of a country, and calculate the population density of large cities in that country. They are able to create an appropriate graph to represent their data for that country.
Curated OER
Pictograph to Bar Graph
Second graders explore organizing data to make it useful for interpreting picture graphs and bar graphs. They use Graphers software to create a pictograph and a bar graph.
Curated OER
Fast Food Survey Using Bar Graphs
Second graders conduct survey and sort data according to categories, construct bar graph with intervals of 1, and write a few sentences about their graphs.
Curated OER
Agriculture, Weather, Economy and Indiana
Fourth graders, in groups, investigate the role of weather in Indiana's farming economy. They make a prediction as to weather and its effect on the economy of Indiana. They present their data using a media presentation of data...
Curated OER
Fishkill
Students analyze data to determine the effect of thermal pollution on a certain species of fish. They graph temperature and dissolved oxygen and make inferences on the impact a change in temperature could have on the fish. As a class...


