Statistics Education Web
Now You SeeIt, Now You Don't: Using SeeIt to Compare Stacked Dotplots to Boxplots
How does your data stack up? A hands-on activity asks pupils to collect a set of data by measuring their right-hand reach. Your classes then analyze their data using a free online software program and make conclusions as to the...
NOAA
Graphing Temperatures
Battle of the hemispheres? In the fourth installment of a five-part series, young oceanographers use the NOAA website to collect temperature data from drifters (buoys), one in the Northern Hemisphere and one in the Southern Hemisphere....
Statistics Education Web
Who Sends the Most Text Messages?
The way you use statistics can tell different stories about the same set of data. Here, learners use sets of data to determine which person sends the most text messages. They use random sampling to collect their data and calculate a...
University of Colorado
Is There Life on Earth?
To find life on another planet, scientists look for gases (atmosphere), water, and temperatures that are not extreme. In this activity, groups of pupils become "Titan-ians," scientists who want to explore Earth for possible life forms....
Messenger Education
Mission: Possible—How Can We Plan an Exploration of Another World?
An astronaut's spacesuit weighs 280 pounds and takes 45 minutes to put on — that's a serious suit! The second activity of a three-part series allows pupils to see all that goes into space exploration. Through simulations, groups analyze...
Science Matters
Energy Transfer and Transformation
When you take a simple task and create an exceptionally difficult way to complete it, it is known as a Rube Goldberg machine. These machines are filled with many types of energy transfers and energy transformations. Here, pupils watch...
LABScI
Taxonomy: Who is in My family?
Find similarities in seemingly unlike organisms. The second instructional activity in a series of 12 builds the concept of a taxonomy and explores the use of a dichotomous key. Learners begin in part one by attempting to group a set of...
CK-12 Foundation
Exponent Properties with Variable Expressions: Integer Powers
Exponent properties can be complicated for learners. A creative lesson seeks to simplify the concept and build a solid understanding. Young mathematicians have the opportunity to create numerous expressions and analyze the simplified...
CK-12 Foundation
Multiplying Matrices by a Scalar: Making Matrix Patterns
Scalar multiplication equations can be a drag. Scholars determine missing matrices to make correct scalar matrix multiplication equations. They place the correct matrix into the equations within the interactive resource and analyze the...
CK-12 Foundation
Inverse Variation Models: Speedometer for Inverse Variation Models
Model inverse variation while solving a real-world problem. Young scholars use the interactive lesson to discover the pattern of inverse variation data. They then use that discovery to write and analyze an equation.
California Education Partners
Yum Yum Cereal
Design an efficient cereal box. Scholars use set volume criteria to design a cereal box by applying their knowledge of surface area to determine the cost to create the box. They then determine whether their designs will fit on shelves,...
EngageNY
Creating a Dot Plot
Which dot am I? Pupils create dot plots to represent sample data through the use of frequency tables. The third segment in a series of 22 asks individuals to analyze the dot plots they created. The scholars translate back and forth...
EngageNY
Describing Center, Variability, and Shape of a Data Distribution from a Graphical Representation
What is the typical length of a yellow perch? Pupils analyze a histogram of lengths for a sample of yellow perch from the Great Lakes. They determine which measures of center and variability are best to use based upon the shape of the...
CK-12 Foundation
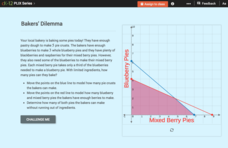
Linear Programming: Bakers' Dilemma
Place the pies in a line. Pupils create a graph of a system of linear inequalities to represent the number of pies a bakery can make. Learners analyze the vertices on the graph to determine the number of pies they can bake without...
CK-12 Foundation
Congruent Angles and Angle Bisectors: Bisecting Pepperoni Pizza
Who doesn't like pizza? A creative lesson uses a piece of pizza to explore angle bisectors and congruent angles. Young scholars work through a simulation to create congruent slices of pizza by analyzing an angle bisector. They then...
CK-12 Foundation
Bisectors of Line Segments and Angles: Cut a Line
Geometric constructions build relationships —by simply manipulating simple tools. An interactive lesson presents a completed construction of a segment bisector and has learners analyze the important aspects. Ultimately, they should be...
CK-12 Foundation
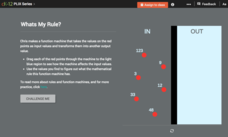
Function Rules for Input-Output Tables: Whats My Rule?
What's the rule that makes it true? A virtual function machine generates output values as learners submit the input values. Their job is to analyze the inputs and outputs for a pattern and write a function rule.
CK-12 Foundation
Frequency Tables to Organize and Display Data: Favorite Films
What information can your class determine if they know the number of people attending movie showings? Using the information about the number of people at each screening, learners develop a frequency table. The pupils analyze the type of...
CK-12 Foundation
Line Plots from Frequency Tables: Sleep Cycles
Demonstrate the ease of using a frequency table. An interactive lesson allows learners to create a frequency table efficiently. Challenge questions ask your classes to analyze the data represented in the frequency table.
CK-12 Foundation
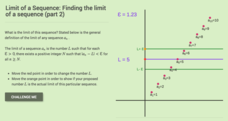
Limit of a Sequence: Finding the Limit of a Sequence (Part 2)
What does it mean if young mathematicians cannot put the squeeze on a sequence? Learners investigate a divergent sequence and find the formula for the nth term. Using the definition of a limit of a sequence, pupils try to find the limit...
Teach Engineering
Energy Intelligence Agency
Protect the world from energy depletion—join the Energy Intelligence Agency. Using a set of cards, pupils distinguish between correct and incorrect information regarding energy use in the United States. They analyze graphs and diagrams...
Howard Hughes Medical Institute
Scientific Inquiry Using WildCam Gorongosa
How do scientists determine what questions to ask to meet their research goals? Help your class develop an inquiry mindset with a lesson based on studies in the Gorongosa National Park. Partners create their own research questions by...
Kenan Fellows
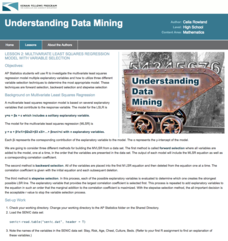
Multivariate Least Squares Regression Model with Variable Selection
The risk of contracting an infection in the hospital is low, but it does happen. Learn what risk factors have the highest correlation with hospital-acquired infections in the final lesson of a three-part series. Using the open source R...
University of California
Containing Communism Abroad
Learn more about the policy of the United States to contain communism during the Cold War. The fifth installment of an eight-part series looks at primary and secondary materials about a challenging time in history. After analyzing the...
Other popular searches
- Analyze Setting Literature
- Analyze Setting Conflict
- Analyze Setting Theme
- Analyze Setting in Fiction


