Curated OER
Constitution/Impeachment/Reconstruction
Eleventh graders analyze a chart comparing U.S. census data from 1850, 1880, 1900, and 1920. They read a handout summarizing immigration legislation from 1882-1996 and create a graph charting how open / closed U.S. immigration is over time.
Curated OER
Samples and Stats
Students explore different methods of taking surveys and conducting polls and examine these methods for bias. They design and administer a sample survey, analyze the data and present their findings to the class.
Curated OER
Entrepreneurship: Will it Work?
Consider to possibility of starting a business as a way to examine the concept of entrepreneurship. Learners develop and analyze feasibility studies, marketing strategies, proposals, and local census data all needed when starting a small...
Curated OER
2006 Census Teacher's Kit: Consequences Report Card
In this analyzing the Census learning exercise, students assess the consequences of change using data from the 2006 Census. Students analyze the economic, social, and political wellbeing of each stakeholder.
Curated OER
The Immigrant Experience
Students utilize oral histories to discover, analyze, and interpret immigration and migration in the history of the United States. A goal of the unit is fostering a discussion and encouraging students to make meaning of the bigger...
Curated OER
Technology - Data Collection
Students collect and analyze data from the United States Census Bureau. Using spreadsheet technology, students explore their results and make preductions about income groups. Students compute the mean, median and mode. They create...
Curated OER
Meatiest States: Graph Problem Solving
For this graph problem solving worksheet, learners analyze a graph that shows commercial red meat production in five states. Students answer 5 word problems using the data on the graph.
Curated OER
US Population 1982-1988
Your algebra learners make predictions using the concepts of a linear model from real-life data given in table form. Learners analyze and discuss solutions without having to write a linear equation.
US Department of Commerce
Exploring Sampling Variability - Higher Education Attainment Across The United States
More education in statistics is always beneficial. Given cards that provide the proportion of adults with bachelor's degrees in 10 random US states, scholars individually determine the sample percentage of states in which more than 30...
Curated OER
A Look at the Population Density of the United States
Students acquire census information and create maps of the population density of the United States on different scales. They role play the roles of workers of a retail company and they use the population data to market to their customers.
Curated OER
Maryland During the Secession Crisis
Students identify the problems Maryland encountered during the secession crisis. They analyze census data and through an examination of the resolutions made by Maryland's Southern Rights Convention of 1861.
Curated OER
Canada Recycles! Do You?: Grades 4-6
In this recycling education instructional activity, students read a table regarding Canadian recycling statistics and respond to 9 questions regarding the data.
Curated OER
Fish Stix
Students explore population biology. They describe and demonstrate
a visual census technique commonly used to survey reef fish populations. In addition, they analyze and interpret data from surveys of coral reef fish populations.
Curated OER
How Does Your Population Grown?
Do you know how the population has grown of your community? Can you predict the population over the next half century? Can we find an algebraic model that matches our data? These along with many more questions can be researched by...
Curated OER
Suburbanization: Yesterday And Today
Students compare physical and cultural landscapes of the Twin Cities between 1990-2000. Using census data, aerial photos, and land use maps, they discover and analyze the changes that have occurred in the region as a result of...
Curated OER
What is the Population Distribution of Cartoon Characters Living On the Pages of Your Newspaper?
Students read various cartoons in their local newspaper and calculate the population demographics, spatial distribution and grouping of the characters. Using this information, they create a population distribution map and share them with...
Curated OER
Drug Sales Soar: Bar Graph
In this graphs worksheet, students analyze a bar graph that shows retail prescription drug sales in the U.S. Students complete five problem solving questions about the data on the graph.
Curated OER
Making Sense of the Census
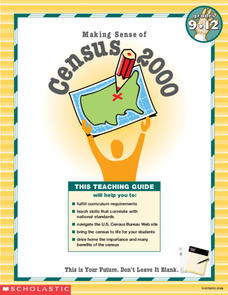
In this unit of lessons, students make sense of the census. They examine why a census is taken and participate in activities.
Curated OER
Making Sense of the Census
For this unit of lessons, students make sense of the census. They examine why a census is taken and partipate in activities.
Curated OER
Housing Arrangements of the Elderly in Canada
Students examine housing for the elderly in Canada. In this sociology lesson, students analyze Canadian Census data to find out what type of housing seniors of the country live in.
Curated OER
Graphs! Graphs! Graphs!
Students practice making charts and graphs from data on spreadsheets. Individually, they create a graph representing the latest information on voter registration. They answer questions and analyze the data to end the lesson.
Curated OER
World Statistic Day
Eleventh graders collect data about the state they live in. In this statistics lesson, 11th graders collect and analyze data as they compare themselves to students in other states. They analyze data about a person's education level, and...
Curated OER
Young Voters Make A Difference
Students research recent statistics on voting by those 18 to 24. They survey senior students to determine their intent to vote in the next election. Students display the data in charts and graphs. They write the results and share it with...
Curated OER
The New Segregation
Students use census data to analyze the racial and economic diversity of their community. They discuss the role of diversity within communities and the impact that land use decisions can have on the composition of a community.


