Science Education Resource Center at Carleton College
Serc: The Digital Divide: A Data Analysis Activity Using Subtotals
A lesson plan that includes a PowerPoint learning module for students. The purpose of the lesson is to teach how to use Excel to analyze a large amount of data, in this case from the US Census. The example being used is the accessibility...
Other
Integrated Public Use Microdata Series
Census data is available here for extraction in various configurations--provides a resource for math and social studies collaboration analyzing and sorting data.
US Census Bureau
U.s. Census Bureau: Measuring 50 Years of Economic Change [Pdf]
A lengthy report published in 1998 that analyzes historical changes in the US economy and labor force, based on data collected by the Census Bureau.
PBS
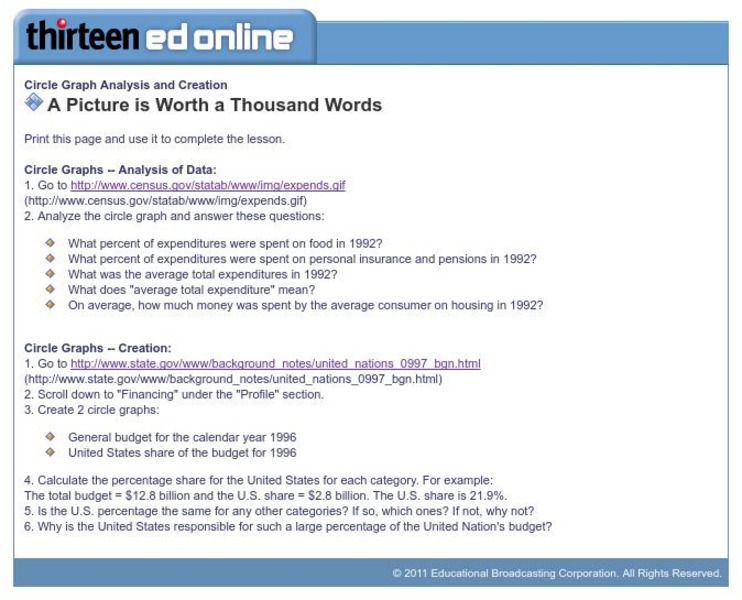
Wnet: Thirteen: Circle Graph Analysis and Creation
This site, which is provided for by WNET, gives a great way to practice using circle graphs through these exercises. One is analyzing a pie graph from the Census Bureau and the other creating pie charts using government data.
University of Regina (Canada)
University of Regina: Math Central: Bias or No Bias?
Students analyze the types of biases in surveys and how they affect the outcomes. A downloadable version of the activity and a survey activity are included. This lesson is from a group of lessons that uses "Census at School" data.


![U.s. Census Bureau: Measuring 50 Years of Economic Change [Pdf] Activity U.s. Census Bureau: Measuring 50 Years of Economic Change [Pdf] Activity](https://d15y2dacu3jp90.cloudfront.net/images/attachment_defaults/resource/large/FPO-knovation.png)

