Curated OER
Linear Functions
Students solve and graph linear equations. In this algebra instructional activity, students collect data and plot it to create a linear function. They identify the domain and range of each line.
Curated OER
VARIABLES AND PATTERNS, USE AFTER INVESTIGATION THREE. DISCRETE OR CONTINUOUS LINEAR RELATIONS.
Learners discover for which kind of linear function is appropriate to use the "scatter" or the "connected" term. In this instructional activity, students investigate functions using variables, patterns book, graph paper, rulers and the...
Curated OER
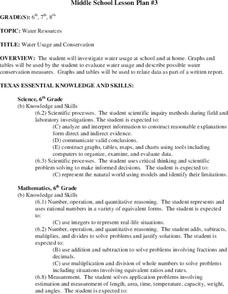
Water Usage and Conservation
Pupils investigate water usage at school and at home. They use graphs and tables to evaluate water usage. Students describe possible water conservation measures. They use graphs and tables to relate data as part of a written report.
Curated OER
Mathematical Magazines
Young scholars classify and tabulate the type of advertisements found in a collection of magazines. Determination is made on what percent of the total number of ads each type represents. They present their results orally and in a graph.
Curated OER
The Survey Says
Young scholars experience the development of statistical data. In groups, they construct a survey questionnaire for a target audience. Students produce the questionnaire, distribute it, collect it, and tabulate the data. Using EXCEL,...
Curated OER
Chew on This
Eighth graders explore and demonstrate the seven steps of the scientific method. They predict how much sugar is in chewing gum and test, analyze, and calculate the sugar content of gum.
Curated OER
Solar Energy - Dehydration
Sixth graders explore process of drying food using solar energy. They cook and/or dry food such as pumpkins, watermelon, corn, and deer meat, explain how solar energy changes foods, and compare and contrast solar energy with other forms...
Curated OER
You Scratch my Back, I'll Scratch Yours
Students explore the concept of interdependence. In this integrated interdependence lesson, students interpret graphs and charts that require them to analyze the relationship between Mexico and the United States. Students also...
Curated OER
The Sixties Protests and Social Change
Students identify, examine and analyze photographs of the sixties to determine the forces of social change at work in America during this decade. They determine the goals of each movement and the methods used by each to achieve those goals.
Curated OER
Using the Question Matrix
Students analyze and develop questions about a text. For this asking questions lesson, students read an article and analyze the information within the text. Students then form and answer questions about the text.
Curated OER
Squares and Cubes
Middle schoolers recognize, analyze, and use square color tiles and interlocking cubes to discover patterns in perimeter, area, and volume. They will then chart and graph their results.
Curated OER
Supermarket Smarts
Pupils examine how a consumer can make informed choices. They visit stores with a prepared shopping list, record the prices on a spreadsheet, create graphs, and create a Powerpoint presentation comparing the total cost of stores and a...
Curated OER
Cancer: A Crisis of the Cells
Pupils analyze cancer data represented in graphs and charts. They describe the changes in cell structure and function as the result of cancer. They also examine phenomenas that are believed to cause cancer.
Curated OER
Discovering the Problem of Solid Waste
Learners catagorize the types of garbage from going through a trash can provided by their teacher. They then chart the items on a graph and propose a solution to reduce the amount of garbage.
Curated OER
Cold Enough?
Students read and record temperatures and display the data. They represent the temperatures on an appropriate graph and explain completely what was done and why it was done. Students display the data showing differences in the daily...
Curated OER
Color Me Hot
Seventh graders use the scientific method, to observe, record and analyze the data they gathered. They make observations using their five senses. Students compare, contrast and draw conclusions based on the observations and data...
Curated OER
Natural Resources
Fifth graders begin the lesson by identifying the different types of natural resources. As a class, they discuss how environments are destructed and how the loss of one natural resource can affect the economy. Using a map, they label the...
Curated OER
Does my career fit me?
Young scholars create a venn diagram about the job they currently have and if they think it is what they should be doing. In this job lesson plan, students list education and job duties in a venn diagram and analyze if it is the correct...
Curated OER
THE FEDERAL CONFIRMATION PROCESS: CHOOSING THE RIGHT PERSON FOR THE JOB
Students analyze the process whereby presidential appointees are confirmed.
Curated OER
Seed Growth
Students develop an independent procedure to investigate the germination of two types of seeds. Students must construct data tables or charts to record observations and results, graph the data, and analyze the data.
Curated OER
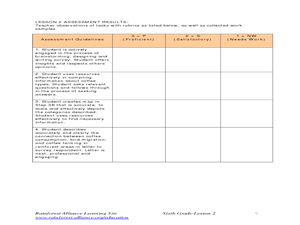
Whose Breakfast isn't for the Birds?
Students explore coffee production. In this cross-curriculum rainforest ecology lesson, students research regions where coffee comes from and investigate how the native birds in the rainforest are effected by coffee production. ...
Curated OER
A Thanksgiving Feast
Students compare a Thanksgiving feast of today to the Thanksgiving feast of 1621. They analyze information to write a Rebus story about a Thanksgiving feast of today of the Thanksgiving feast of 1621. Pupils describe a typical...
Curated OER
Comparison of Snow Cover on Different Continents
Students use the Live Access Server (LAS) to form maps and a numerical text file of snow cover for each continent on a particular date. They analyze the data for each map and corresponding text file to determine an estimate of snow cover...
Curated OER
Linkages Between Surface Temperature And Tropospheric Ozone
Students collect and interpret data to make predictions about the levels of ozone in the atmosphere. Using the internet to collect data students use their collected data to create a line graph for analysis. Students make mathematical...


