Curated OER
West Virginia State Museum Lesson Plan: West Virginia Music
Students compare and contrast music about West Virginia. In this West Virginia history lesson, students analyze popular music so that they may gain an understanding of the relationships between songs and history. Students then create...
Curated OER
Understanding Europe: A Cultural Mosaic (Theme 1)
Students discuss the cultural similarities and differences found in Northen Europe, Southern Europe, Western Europe, and Eastern Europe and create daily journal entries charting their discoveries. This lesson is the First Part in a Four...
Curated OER
Save Our Forests
Fifth graders discuss the forest products industry and its affects upon their communities. They inventory the wood and paper products they consume and determine how it translates into the number of trees cut. Using a spreadsheet, they...
Curated OER
Be the Kiwi: Gender Roles
Learners take a look at gender roles in New Zealand. In this global issues instructional activity, students analyze statistics that reveal the divide between men and women employees in the country.
Curated OER
One, Two, Three...and They're Off
Students make origami frogs to race. After the race they measure the distance raced, collect the data, enter it into a chart. They then find the mean, median, and mode of the data. Next, students enter this data into Excel at which time...
Curated OER
Lines of Best Fit
Students explore the concept of line of best fit. In this line of best fit instructional activity, students find lines of best fit in examples about riding your bike home from school and dentistry. Students find two data points and find...
Curated OER
Technology Integration Lesson Plan: Civil War Spreadsheet
Eighth graders discuss and analyze Civil War data, manually graph data on handout, work with partners to enter data into spreadsheets, and create charts on spreadsheet for each data set.
Curated OER
Awesome Animals
Students collect data from classmates about their favorite animal. They use the ClarisWorks graphing program to enter data, graph results, and interpret data.
Curated OER
Immigration Push and Pull Factors
Eighth graders examine significant ideas, beliefs, and themes; organize patterns and events; and analyze how individuals and societies have changed over time in Maryland, the United States, and the world.
Curated OER
Rain Drops Keep Falin' On My Drainage Basin
Students compile information about rainfall, lake elevations and releases of water from Tuttle Creek reservoir into maps, graphs and charts.
Curated OER
Water Quality Comparison of Pulpit Rock Stream and Welton Falls
Eighth graders analyze different water samples given to them by their teacher.
Curated OER
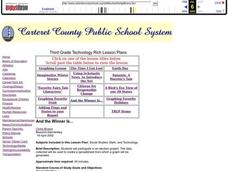
And the Winner Is...
Third graders participate in an election project. They collect data to create a spreadsheet from which a graph is generated.
Curated OER
Discovering Demographics
High schoolers analyze demographic data including a statistical overview of India. Students synthesize their findings and create an informational poster about India.
Curated OER
Social Studies: Canadian City Comparison
Students research Canadian population distribution while comparing and contrasting the quality of life in two cities. They discuss issues and problems that cities and rural towns face. Students apply various methods, such as graphs and...
Curated OER
An Apple A Day
Learners create a graph that showcases their pick for favorite kind of apple. Students are given samples of a variety of apples to determine their favorite in a taste test. They a create a tally chart of favorite kinds apples and use a...
Curated OER
Site vs. Situation: Location! Location! Location!
Students examine places with a similar latitude to Alabama, and discuss the importance of a location's site versus its situation. They analyze maps, create a chart, and write a paragraph on the difference between site and situation.
Curated OER
Mass Transit
Students explore the world of mass transit and how it affects their community as well as how it attempts to reduce our pollution mass. Included as well are the environmental and social factors relating to mass transit. They read and...
Curated OER
Tag It and Bag It: Archeology Lab Lesson
Seventh graders practice analyzing, collecting and categorizing artifacts. Using charts, they organize and interpret information about the artifacts they classified. They work together to create a graph to represent class totals and...
Curated OER
Ratios Through Social Studies
Students analyze and integrate mathematical concepts within the context of social studies. They gather, present and analyze information on a bar graph, pie chart, etc. Students compute ratios. They demonstrate that ratios have real-world...
Curated OER
Checking County Numbers
Learners use their county's information page to gather information about their community. Using the information, they create graphs from the tables provided and interpret the data. They write a paragraph showing their interpretation of...
Curated OER
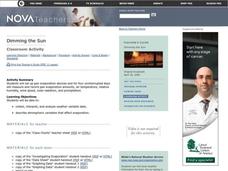
Dimming the Sun
Students collect, interpret and analyze weather variable data. They describe atmospheric variables that affect evaporation. Students create graphs and analyze the information collected.
Curated OER
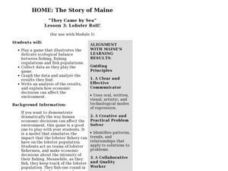
Lesson 3: Lobster Roll!
Students play a game that illustrates the delicate ecological balance between fishing, fishing regulations and fish populations. They collect data and analyze the results.
Curated OER
The Bigger they Are . . .
Pupils do a variety of data analyses of real-life basketball statistics from the NBA. They chart and graph rebounding, scoring, shot blocking and steals data which are gathered from the newspaper sports section.


