Curated OER
Exploration of Civil War Webquest
Students use the internet to research what life was like for Confederate and Union soldiers in a specific battle of interest to them. In groups, they complete a webquest on the battle in which one represents a Confederate soldier and the...
Curated OER
Creating with Alice
Students explore Alice Programming Software. In this exploratory lesson, students design a unique storyboard which will guide the creation of their Alice World. Students write and create their own films.
Curated OER
Passport to the Eastern Hemisphere
Seventh graders create a time line of significant dates in the history of their nation. This requires students to examine the entire history of a country and make informed judgments based on their historical knowledge.
Curated OER
Carbondale: The Biography of a Coal Town
Students use a brief history of the growth and decline of the anthracite region in the state to create a photograph and map "peak shaped" time line. They practice map and photo analysis strategies to "read" photographs and maps.
Curated OER
CURRENT AND CLIMATE
Learners study currents and how they have been used to plot courses for travel. They examine the ocean currents in both the Atlantic and Pacific and discuss their effect on local weather.
Curated OER
JEPSON PRAIRIE RESERVE RESEARCH PROJECT
Students research a field question of their choosing.
Curated OER
Chain Across the Hudson
Fourth graders role play as contractors responsible for constructing a chain across the Hudson River. They apply math skills to determine the total weight, number of links, and cost of the project.
Curated OER
Using an Amortization Table
Students search the Internet to find a site that contains an amortization table and make a hypothesis about the results of changing time and rate. They examine the affects of time and rate on a mortgage and discuss the difference in the...
Curated OER
Science: Hurricanes As Heat Engines
Students conduct Internet research to track the path of Hurricane Rita. They record the sea surface temperature of the Gulf of Mexico during and after the hurricane and draw conclusions about how hurricanes extract heat energy from the...
Curated OER
Pieces of the Past
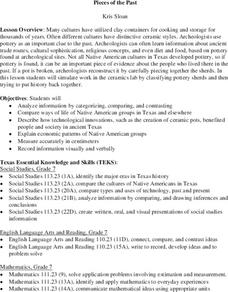
Seventh graders compare and contrast the way of life of Native Americans in Texas and around the country. As a class, they brainstorm about the uses of pottery today and use broken pieces of pottery to create an artifact. In groups,...
Curated OER
The Constitution
Students use both electronic and traditional resources to research information about U.S. Constitution, answer questions pertaining to Congress and the Presidency, and design HyperStudio presentation to display answers to research...
Curated OER
Surface Water Supplies And The Texas Settlements
Pupils engage in a lesson that is concerned with the allocation and finding of water resources. The location of different settlement areas is considered as one looks how the water is distributed. They map some of the early Spanish and...
Curated OER
Writing Directions for Mathematical Activities
Fifth graders reorganize comic strips to have them make sense, complete outline and organize their thoughts into outline form to explain directions,
and use that outline to complete their own directions for geometry activities.
Curated OER
Watershed Management
Students investigate the concept of a watershed. They conduct research into the concept using a variety of resources. Students take a field trip to a local watershed to make observations. The outcome is a report concerning the outside...
Curated OER
Affects of Geography on Colonial Cultures
Sixth graders examine the effects of geography on the development of culture. They discuss how geography can affect the lifestyles and development of a society's culture. Students examine the geography and climate of New England and the...
Curated OER
Blowing in the Wind
Pupils compare hurricanes and tornadoes. They write a paragraph explaining how to prepare for a storm. Students give an oral report. They use weather facts to practice math skills. Pupils record observations of a storm.
Curated OER
Science: Backyard Bugs Data Collection
Students practice data collection skills by observing common bugs found in their local environment. Once the data is collected they complete data sheets to compare, contrast, sort, and classify the insects. The lesson includes...
Curated OER
Quarter Coin Cookies
Young scholars study the historical figures and symbols of U.S.
patriotism depicted on the penny, nickel, dime, and quarter coins. They explore the processes involved in making coins, and how metals canchange in consistency from the...
Curated OER
What Does a Quarter Weigh?
Learners study the historical figures and symbols of U.S.
patriotism depicted on the penny, nickel, dime, and quarter coins. They
create a balance scale from common materials to measure the approximate weight
of a quarter.
Curated OER
What are Quarters Made of?
Learners study the meaning, symbolism, and value of U.S. coins,
especially the quarter. They l research why in 1965 the U.S. Mint decided to
change the metal composition of the quarter to copper coated with zinc. In addition, they...
Texas Education Agency
Texas Gateway: Analyze Graphical Sources: Practice 2 (English I Reading)
This lesson focuses on practice exercises to understand and interpret the data in a graphic representations including pie charts, bar graphs, and line graphs.
Better Lesson
Better Lesson: Circle Graph Activity
This lesson will allow the student to work through three stations. The stations will focus on creating and analyzing circle graphs. The students will be using technology to create their graphs along with a hands-on activity using M&M's.
Texas Education Agency
Texas Gateway: Analyze Graphical Sources: Practice 2 (English Ii Reading)
[Accessible by TX Educators. Free Registration/Login Required] Analyze the factual, quantitative, and technical data in graphs and charts.
Utah Education Network
Uen: Familiarizing Students With the 5 Food Groups
This module provides a multiple-day unit about the five food groups. Teachers of the unit will explicitly teach students about analyzing charts. Then students will gain exposure with written and visual resources to help apply the...


