Missouri Department of Elementary
Fly Your Kite
Encourage scholars to become a productive community member with a kite-themed lesson. Following a review and discussion, learners complete a Venn diagram that displays the connection between character traits needed to make a home and...
Curated OER
Hopes and Dreams: A Spreadsheet Lesson Using Excel
Fourth graders read "The Far Away Drawer" by Harriet Diller and discuss the story as a class. After discussion, 4th graders create a t-shirt GLYPH about their hopes and dreams,share their information with the class and create spreadsheets.
Curated OER
You Are What You Eat (High School)
Students evaluate data from a statistical chart or graph which they find in a newspaper or magazine.
Pennsylvania Department of Education
Eye to Eye
Students practice the concept of posing mathematical questions regarding themselves and their surroundings. In this eye to eye lesson, students gather data about eye color from their classmates. Students organize their data in order to...
Curated OER
Graphic Favorite Breakfast Foods
Second graders graph data based on a class survey of their favorite breakfast foods. In this graphing lesson plan, 2nd graders take a class survey of their favorite breakfast foods. Then they take that data and put it into a computer...
Curated OER
Unit 2: Lesson 7
Students are introduced to spreadsheets. They conduct a survey of television viewing time of different shows based on different age categories. Students work in small groups. They collect, data and interpret the data from a survey.
Curated OER
Mystery Graphs
Pupils study graphs and learn how to display information into a graph. In this graph lesson plan, students construct a graph of their own sorted data, and pick out things in graphs that are inconsistent.
Curated OER
Jellybean Graphs
Second graders predict and graph data based on the color of jelly beans they think are in a handful. In this prediction lesson plan, 2nd graders will predict how many of each color jellybean are in a handful. Then they graph these...
Curated OER
What's Your Favorite Season?
Pupils collect data on the favorite seasons. In this data collection and analysis lesson, students learn about displaying data on charts and graphs. They collect data about the favorite seasons of the children in their class and display...
Curated OER
Which Time of Day Do You Like Best?-- Class Bar Graph
In this math worksheet, students collaborate in making a bar graph which displays their favorite time of day: art, music, gym or library. The class is surveyed and responses are plotted on this graph.
Curated OER
Which Kind of Weather Do You Like Best? -- Class Bar Graph
In this math worksheet, students generate a class bar graph. Classmates are surveyed about favorite weather: sunny, rainy, snowy, cloudy or windy. Results are displayed on a bar graph.
Curated OER
More Density Graph Questions
In this density graph learning exercise, students graph data displayed in a chart. Students also calculate the density of each metal shown in the graph. Students answer questions about which detail is more dense.
Curated OER
Buzzing is BEE-lieving
Students investigate insects. In this insect lesson, students explore various insect models and identify the characteristics of each. Students observe insects outside and tally how many insects they observe.
Curated OER
Bones and Math
students identify and explore the connection between math and the bones of the human body. Students collect data about bones from their classmates and from adults, apply formulas that relate this data to a person's height, and organize...
Curated OER
Graphing Pockets
Second graders explore graphing. They count the number of pockets on their clothes and use Microsoft Excel to enter their data. Students create a class graph displaying their findings.
Curated OER
A Picture is Worth a Thousand Words
Sixth graders work to write questions for a class survey. In this survey lesson plan, 6th graders survey their class members by asking the 4 questions they developed and will record their answers on the culminating assessment provided by...
Curated OER
Awesome Animals
Students collect data from classmates about their favorite animal. They use the ClarisWorks graphing program to enter data, graph results, and interpret data.
Curated OER
We Are Having a Party! Part I
Second graders use data analysis skills in order to plan a class party. They graph possible times for the party noting the range for times. They discuss how mathematicians find and use the range to analyze data.
Curated OER
Displaying The Data
Students engage in a research project to find information about one's personal family heritage. They collect information by conducting family interviews. Students use the data to create a graph, map, and timeline. Then students take part...
Curated OER
Central Tendencies and Normal Distribution Curve
Fourth graders are given data (class test scores) to determine central tendencies, and find information needed to construct a normal distribution curve. They become proficient in calculating mode, median and average.
Curated OER
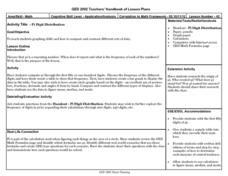
Pi Digit Distribution
Students study graphing skills and compare and contrast data sets. They compute pi through the first 50-100 digits and create a bar graph showing the frequencies of specific digits.
Curated OER
Confusing Colors!
Fourth graders collect data, graph their data, and then make predictions based upon their findings. They's interest is maintained by the interesting way the data is collected. The data collection experiment is from the psychology work of...
Curated OER
Favorite Survey
Fourth graders collect and organize data for charts and bar graphs by questioning their classmates. They utilize a worksheet imbedded in this plan which guides them through their 'favorites' survey.
Curated OER
Range and Measures of Central Tendency
Third graders take notes on a PowerPoint presentation featuring calculating and analyzing data. They practice skills highlighted in the presentation and create a table in Microsoft Excel showing data analysis.


