Texas Instruments
Endothermic and Exothermic Processes
Learners investigate temperature using the TI. In this chemistry lesson, students analyze the change in temperature, as chemicals are dissolved in water. They analyze data collected using the CBL 2.
Curated OER
NUMB3RS Activity: Where’s the Source? Episode: “Undercurrents”
Several real-world problems are posed as a way to learn about vector fields in order to make some predictions after analyzing the data. The main problem comes from the tv show NUMB3RS and is based on solving a crime where a body has...
Curated OER
Do I Have What it Takes to be an Entrepreneur - and is My Community Ready?
Discover the attributes of entrepreneurs and define what entrepreneurship is while examining data based on local businesses. Learners determine whether their community is supportive of entrepreneurs as they research economic development...
Illustrative Mathematics
The Marble Jar
A jar is filled with 1,500 marbles and customers of a bank can enter a contest to guess the correct percentage of blue marbles. How can an employee at the bank estimate the actual percentage without physically counting all 1,500 marbles?...
Foundation for Water & Energy Education
How Can Work Be Done with Water Power? Activity C
Third in a set of lessons regarding reservoirs, dams, and hydropower, this involves a two-day hydropower plant simulation. Collaborative groups build, maintain, and finance the plant. The transparency of the reservoir setup can be...
Math Worksheets Land
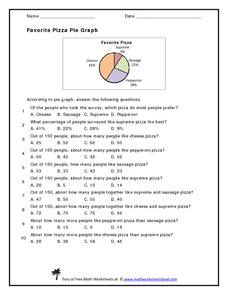
Favorite Pizza Pie Graph
You've heard of a pie graph, but what about a pizza pie graph? Challenge young mathematicians to answer ten questions based on a random survey of people's favorite pizzas. A pie graph displays the percentages of each type of pizza. Some...
National Academy of Sciences
CO2 and Temperature
Scientists can model global surface temperature with and without considering human emissions, but does do these factors really make a difference? Two interactive graphs demonstrate some factors that affect climate change. The first graph...
Shodor Education Foundation
Graphit
No graphing calculator? No worries, there's an app for that! Young mathematicians use an app to graph functions. In addition, they can also plot data points.
Shodor Education Foundation
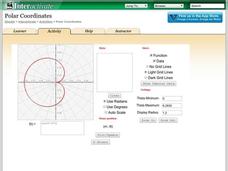
Polar Coordinates
Polar opposites might not work together—but polar coordinates do! The interactive provides learners the opportunity to graph trigonometric and algebraic functions using polar coordinates. The program takes either individual data points...
Curated OER
Baseball Relationships - Using Scatter Plots
Students use graphing calculators to create scatter plots of given baseball data. They also determine percentages and ratios, slope, y-intercepts, etc. all using baseball data and statistics.
Curated OER
Environmental Issues in Multimedia Presentation
Students investigate a community environmental issue. They document it using traditional scientific methods, digital photography, and videotaping. After collecting data, they graph the results. Students present their findings in a...
Curated OER
Displaying Data
Students create a display map with data from a previous lesson. They incorporate graduated marks that identify areas of the school grounds that are good for planting based on density.
Curated OER
Introduction to Graphs: Bar Graphs, Line Graphs, Circle Graphs
In this graphing data worksheet, middle schoolers answer 5 short answer questions about graphs. Students determine which type of graph best represents various data sets.
Curated OER
Critter Encounter Chart
Learners record data found at an assigned web site. In this data collection lesson, students access an assigned web site in order to complete a data chart about animals they see. They travel to different sections of the web site to find...
Curated OER
Math: Giant Alaskan Cabbages
Students analyze data from the Alaska State Fair's "Giant Cabbage Weigh-Off." Once they have sorted the weights, they calculate the range, mean, mode, and median of the cabbages. Finally, students create posters displaying their...
Curated OER
Data Processing
Young scholars explore the application of Geographic Information Systems (GIS) in a variety of businesses and organizations. They present proposals, representing different businesses and organizations, that support how GIS technology...
Curated OER
Bisphenol A and Diabetes
Pupils summarize the data that is displayed and examine how bisphenol A behaves and how it contributes to diabetes. Learners also study an article and interpret line graphs.
Curated OER
Iced In
Introduce junior oceanographers to ice conditions in The Great Lakes. The ice map links are no longer available, so you will not be able to have your class perform the mentioned data activity. You can, however, access the Canadian Ice...
Weather Bug
WeatherBug
Exploring the weather has never been more intriguing! Whether you are looking for a quick glance at the 10-day forecast, trying to figure out if lightning is heading your way, or wondering what the pollen count is, you will find out...
Curated OER
Integrating Gandhian Principles of Communal Unity in Mathematics
Fourth through sixth graders incorporate Gandhian principles into Math curriculum. They explore Gandhi's teachings on communal unity and economic equality. This has quite a bit of information about Gandhi and his observations and...
Saxon
Plotting Functions
Youngsters use a graphing calculator to assist in creating a function table. They graph the function on a coordinate plane. They explore the relationship between the domain and range in the graph. This four-page activity contains two...
Curated OER
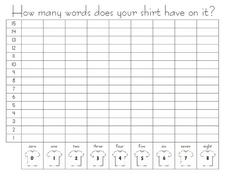
How Many Word Does Your Shirt Have on It? --class Bar Graph
In this math instructional activity, learners participate in a group bar graph activity. Students survey classmates about how many words, if any, are on their shirts. Results are plotted on a bar graph.
Howard Hughes Medical Institute
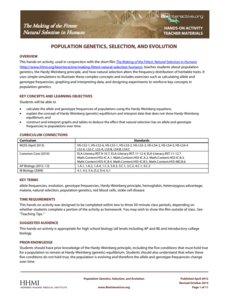
Population Genetics, Selection, and Evolution
The Hardy-Weinberg principle states that alleles and genotypes remain constant in the absence of evolutionary influences. Scholars complete a simple hands-on activity applying the Hardy-Weinberg principle to sample data. They observe how...
Michigan State University
In Search of Life
Explore the habitats around you with an activity that takes kids out of the classroom to learn about the local variety of habitats and the living things that call them home. In small groups, scholars investigate their surroundings,...


