Curated OER
It's Your Life - Safe or Sorry/Safety Issues
Students examine and chart data about safety hazards and unsafe situations. In this safety hazard lesson, students examine newspapers and web sites to investigate injuries from safety hazards. They make a spreadsheet using the data and...
Curated OER
Residential Power System
Perform data analysis on energy consumption to apply algebraic expressions to the real world. Learners will write and solve equations that answer various questions from residential power use. They will collect data at home and calculate...
Education World
The African American Population in US History
How has the African American population changed over the years? Learners use charts, statistical data, and maps to see how populations in African American communities have changed since the 1860s. Activity modifications are included to...
EngageNY
Revisiting the Graphs of the Trigonometric Functions
Use the graphs of the trigonometric functions to set the stage to inverse functions. The lesson plan reviews the graphs of the basic trigonometric functions and their transformations. Pupils use their knowledge of graphing functions to...
Teach Engineering
Graphing Equations on the Cartesian Plane: Slope
Slopes are not just for skiing. Instructors introduce class members to the concept of slope and teach them how to calculate the slope from a graph or from points. The lesson plan also includes the discussion of slopes of parallel and...
Curated OER
Elastic Recoil in Arteries and Veins
A lab in which high schoolers examine the difference between arteries and veins. Budding biologists will find out which blood vessel can stretch furthest, recording their data in a table then answering several questions evaluating their...
Curated OER
Data Analysis of Ground Level Ozone
Sixth graders construct and interpret graphs from ozone data collected in Phoenix area. Can be adapted to other areas.
Curated OER
What's Up With My Class
Learners collect data about their class and they use Excel spreadsheet to display their tables and graphs about the class. They answer survey questions and collect their data. Students create a graph of their choice to display the...
Curated OER
Comparing School Bus Stats
Engage in a lesson that is about the use of statistics to examine the number of school buses used in particular states. They perform the research and record the data on the appropriate type of graph. Then they solve related word problems.
Curated OER
DATA ANALYSIS OF GROUND LEVEL OZONE
Sixth graders construct and interpret graphs from ozone data collected in the Phoenix area.
Curated OER
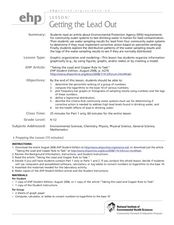
Getting the Lead Out
The article for this instructional activity no longer accessible through the links in the lesson plan, but can be found in the National Center for Biotechnology Information website. After reading it, environmental science high schoolers...
Curated OER
What's My Pattern?
Students recognize, describe and extend patterns in three activities. They organize data, find patterns and describe the rule for the pattern as well as use the graphing calculator to graph the data to make and test predictions. In the...
Curated OER
Graphing Data
Second graders graph data about their classmates. For this data analysis lesson, 2nd graders ask each other several questions about their hair color and eye color. Students graph the data that they collected.
Curated OER
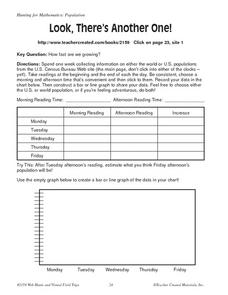
Look, There's Another One!
In this math worksheet, learners spend a week collecting information on either the word or U.S. populations from the U.S. Census Bureau Web site. Students record their data in a chart and bar graph. Learners also use the website to...
Curated OER
Analyzing Graphs and Data
Students collect and analyze data. In this statistics instructional activity, students graph their data and make inferences from the collected data. They display their data using graphs, bar graphs, circles graphs and Venn diagrams.
Curated OER
Temperature Bar Graph
Students explore mean, median and mode. In this math lesson, students analyze temperature data and figure the mean, median, and mode of the data. Students graph the data in a bar graph.
Curated OER
Creating Graphs from Tables
Students interpret data from tables and then create a graph to show the same data in a different organization.
Curated OER
Color Tile Graphing
Students explore data. They gather data and generate questions about the data in pictographs, tallies, tables, and bar graphs. Students use color tiles pulled by random to create their own bar graph. They discuss the bar graphs they...
Curated OER
Interpreting Medical Data
Students explore human anatomy by graphing scientific data. In this vision lesson, students discuss how ophthalmology works and take their own eye assessment test using the Snellen chart. Students collect vision data from all of their...
Curated OER
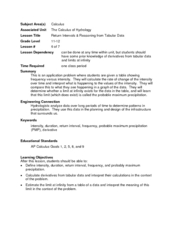
Return Intervals & Reasoning from Tabular Data
Learners calculate derivatives from a set of data. In this calculus instructional activity, students estimate the limit at infinity. They complete a Return Interval handout at the end of the instructional activity.
Curated OER
Does cloud type affect rainfall?
Student use MY NASA DATA to obtain precipitation and cloud type data. They create graphs of data within MY NASA DATA. Students compare different cloud types, compare precipitation, and cloud type data They qualitatively describe graphs...
Curated OER
M&M Graphing
Fourth graders name colors of M&Ms and record answers. They estimate number of M&Ms of each color found in a typical package of M&Ms on piece of paper.They record information on sheet of paper and create a spreadsheet. paper.
Curated OER
Mathematics: A Picture's Worth a Thousand Words
Students examine school yearbooks from 1950 to the present. They count the number of male and female teachers and administrators. They compile date and extrapolate changes in job trends.
Curated OER
Investigating Seasonal Variability in NO2 Concentrations
Young scholars study different formats of data and determine the nitrogen dioxide concentrations. In this seasons lesson students understand the different relationships that NO2 can have.


