Curated OER
Color Tile Graphing
Students explore data. They gather data and generate questions about the data in pictographs, tallies, tables, and bar graphs. Students use color tiles pulled by random to create their own bar graph. They discuss the bar graphs they...
Curated OER
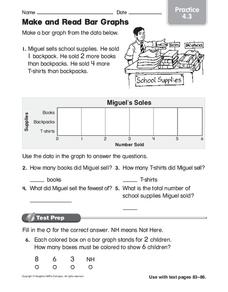
Make and Read Bar Graphs
In this bar graphs instructional activity, students make a bar graph about the sale of school supplies with the data presented in one story problem.
Curated OER
Interpreting Medical Data
Students explore human anatomy by graphing scientific data. In this vision instructional activity, students discuss how ophthalmology works and take their own eye assessment test using the Snellen chart. Students collect vision data from...
Curated OER
Return Intervals & Reasoning from Tabular Data
Learners calculate derivatives from a set of data. For this calculus lesson, students estimate the limit at infinity. They complete a Return Interval handout at the end of the lesson.
Curated OER
Does cloud type affect rainfall?
Student use MY NASA DATA to obtain precipitation and cloud type data. They create graphs of data within MY NASA DATA. Students compare different cloud types, compare precipitation, and cloud type data They qualitatively describe graphs...
Curated OER
M&M Graphing
Fourth graders name colors of M&Ms and record answers. They estimate number of M&Ms of each color found in a typical package of M&Ms on piece of paper.They record information on sheet of paper and create a spreadsheet. paper.
Curated OER
Mathematics: A Picture's Worth a Thousand Words
Students examine school yearbooks from 1950 to the present. They count the number of male and female teachers and administrators. They compile date and extrapolate changes in job trends.
Curated OER
Investigating Seasonal Variability in NO2 Concentrations
Students study different formats of data and determine the nitrogen dioxide concentrations. In this seasons lesson students understand the different relationships that NO2 can have.
Curated OER
Populations Lab - Cultures Lesson: Statistics / Sampling Patterns
Ninth graders examine the application of statistical sampling, data collection, analysis, and representation that exists in schooling and teenage lifestyles in Japan and the United States.
Curated OER
A Day at the Beach
Let's go to the beach! Danielle, Marty, and Phil collected shells at the beach. Can you determine how many shells each child has? Create a picture graph to make the data easier to understand.
Curated OER
Pizza! Pizza!
Third graders tally, sort, and organize pizza orders from monthly school sales. They create an advertising campaign to promote the School Pizza Sale, record the data in graph form, compare and contrast the tallies throughout the year,...
EngageNY
Choosing a Model
There's a function for that! Scholars examine real-world situations to determine which type of function would best model the data in the 23rd installment of a 35-part module. It involves considering the nature of the data in addition to...
Howard Hughes Medical Institute
Scientific Inquiry Using WildCam Gorongosa
How do scientists determine what questions to ask to meet their research goals? Help your class develop an inquiry mindset with a lesson based on studies in the Gorongosa National Park. Partners create their own research questions by...
Balanced Assessment
Dollar Line
Challenge the class to develop a story that matches a graph. The short assessment provides a line graph with the vertical axis labeled as dollars. The task asks pupils to develop a description of a situation that could be represented by...
Curated OER
The Scientific Method, Blood Typing, and Antibiotic Resistance
Students are given some components of an experiment, where they are able to identify and fill in missing parts, such as hypothesis, conclusion, results, etc. They form a hypothesis given general scientific facts. Students apply the...
Curated OER
School Activities
First graders place some specific types of objects (e.g., shoes, favorite food) on concrete graphs and pictographs. They listen and respond to others in a variety of contexts (e.g., pay attention to the speaker; take turns speaking in a...
Curated OER
James and the Giant Peach Plot Analysis
It's all about the plot, main events, and story mapping with this lesson. As the class reads the novel James and the Giant Peach, they create an excitement graph that actually charts key events and moments of excitement. After...
CCSS Math Activities
Smarter Balanced Sample Items: 8th Grade Math – Claim 4
A math model is a good model. A slide show presents 10 sample items on modeling and data analysis. Items from Smarter Balanced illustrate different ways that Claim 4 may be assessed on the 8th grade math assessment. The presentation is...
Inside Mathematics
Vencent's Graphs
I like algebra, but graphing is where I draw the line! Worksheet includes three multiple-part questions on interpreting and drawing line graphs. It focuses on the abstract where neither axis has numbers written in, though both are...
EngageNY
Exponential Decay
I just bought that car, how can its value decrease already? Individuals use the data of a depreciating car value to create an exponential decay model. They then compare exponential decay and growth equations.
Learning Games Lab
Scientific Graph Reading
Interpreting graphs is an essential skill for young scientists. An interactive online lesson gives individuals an opportunity to review the components of a graph and learn to read and interpret the shape of a graph. The lesson includes...
Illustrative Mathematics
Chocolate Bar Sales
In this real-world example, algebra learners start to get a sense of how to represent the relationship between two variables in different ways. They start by looking at a partial table of values that define a linear relationship. They...
Curated OER
Leveled Problem Solving: Range and Outliers
In this range and outliers worksheet, learners solve 6 word problems where they examine data then identify outliers, find the upper and lower quartile ranges, find the interquartile range and create box-and-whisker plots.
US Environmental Protection Agency
Carbon Through the Seasons
Meteorologists view an animated video by the Environmental Protection Agency to learn how the carbon cycle works, and then move into groups to analyze and graph actual data of the atmospheric carbon dioxide concentration from Hawaii's...


