Curated OER
That Was Then, This Is Now
Students examine the price of food over time. They analyze charts, perform math operations and compare and contrast data about the price of food. They complete worksheets while interperting the charts.
Curated OER
Blue Genes: Affect Your Life!
Students, in groups, research, analyze and synthesize information on genetic diseases. After watching a video on genetics, groups perform research on a variety of genetic diseases and present their findings to the class.
Curated OER
Trouble in the Troposphere
Students create graphs using NASA data, compare ozone levels of several U.S. cities, analyze and evaluate the data and predict trends based on the data, and discuss and describe how human activities have modified Earth's air quality.
Curated OER
Paper Parachutes
Students participate in a simulation of a parachute-jump competition by making paper parachutes and then dropping them towards a target on the floor. They measure the distance from the point where the paper parachute lands compared to...
Curated OER
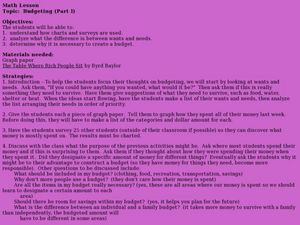
Budgeting (Part 1)
Students examine why a budget may be helpful. In this budgeting lesson plan, students graph how they spent money during the past week. They discuss the benefits of creating a budget and explore the difference between wants and needs.
Curated OER
Linking Real World Data to the Classroom
Students analyze data representing real life scenarios.In this algebra lesson, students collect, plot and analyze data using a graph. They use different methods to represent and present their data.
Curated OER
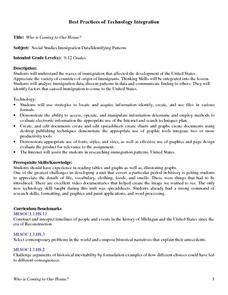
Who is Coming to Our House?
Students examine waves of immigration that affected the development of the United States, appreciate variety of countries of origin of immigrants, analyze immigration data, discern patterns in data and communicate finding to classmates,...
Curated OER
VARIABLES AND PATTERNS, USE AFTER INVESTIGATION THREE. DISCRETE OR CONTINUOUS LINEAR RELATIONS.
Learners discover for which kind of linear function is appropriate to use the "scatter" or the "connected" term. In this instructional activity, students investigate functions using variables, patterns book, graph paper, rulers and the...
Curated OER
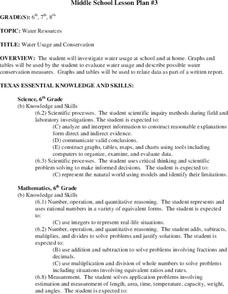
Water Usage and Conservation
Pupils investigate water usage at school and at home. They use graphs and tables to evaluate water usage. Students describe possible water conservation measures. They use graphs and tables to relate data as part of a written report.
Curated OER
The Survey Says
Young scholars experience the development of statistical data. In groups, they construct a survey questionnaire for a target audience. Students produce the questionnaire, distribute it, collect it, and tabulate the data. Using EXCEL,...
Curated OER
Chew on This
Eighth graders explore and demonstrate the seven steps of the scientific method. They predict how much sugar is in chewing gum and test, analyze, and calculate the sugar content of gum.
Curated OER
Solar Energy - Dehydration
Sixth graders explore process of drying food using solar energy. They cook and/or dry food such as pumpkins, watermelon, corn, and deer meat, explain how solar energy changes foods, and compare and contrast solar energy with other forms...
Curated OER
You Scratch my Back, I'll Scratch Yours
Students explore the concept of interdependence. In this integrated interdependence lesson, students interpret graphs and charts that require them to analyze the relationship between Mexico and the United States. Students also...
Curated OER
The Greenhouse Effect
Seventh graders investigate the temperature change in open and closed containers. In this earth science instructional activity, 7th graders relate this lab activity to greenhouse effect. They create a line graph from data collected in...
Curated OER
The Sixties Protests and Social Change
Students identify, examine and analyze photographs of the sixties to determine the forces of social change at work in America during this decade. They determine the goals of each movement and the methods used by each to achieve those goals.
Curated OER
Using the Question Matrix
Young scholars analyze and develop questions about a text. In this asking questions lesson, students read an article and analyze the information within the text. Young scholars then form and answer questions about the text.
Curated OER
Squares and Cubes
Middle schoolers recognize, analyze, and use square color tiles and interlocking cubes to discover patterns in perimeter, area, and volume. They will then chart and graph their results.
Curated OER
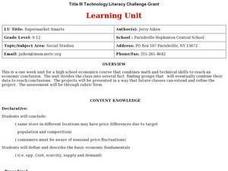
Supermarket Smarts
Pupils examine how a consumer can make informed choices. They visit stores with a prepared shopping list, record the prices on a spreadsheet, create graphs, and create a Powerpoint presentation comparing the total cost of stores and a...
Curated OER
Cancer: A Crisis of the Cells
Pupils analyze cancer data represented in graphs and charts. They describe the changes in cell structure and function as the result of cancer. They also examine phenomenas that are believed to cause cancer.
Curated OER
Discovering the Problem of Solid Waste
Learners catagorize the types of garbage from going through a trash can provided by their teacher. They then chart the items on a graph and propose a solution to reduce the amount of garbage.
Curated OER
Cold Enough?
Students read and record temperatures and display the data. They represent the temperatures on an appropriate graph and explain completely what was done and why it was done. Students display the data showing differences in the daily...
Curated OER
Contemporary Immigration
Eleventh graders analyze the patterns and waves of immigrants that have come to the United States from 1850 to 2000. They participate in a class discussion about immigration, and in small groups conduct research analyzing and evaluating...
Curated OER
Taming the Mighty Dragon
Learners incorporate the five themes of geography to study the Yangtze river region. They analyze the possible effects of the three rivers gorge damn project on this area and role play a float the entire length of this dangerous river...
Curated OER
Does my career fit me?
Young scholars create a venn diagram about the job they currently have and if they think it is what they should be doing. In this job lesson plan, students list education and job duties in a venn diagram and analyze if it is the correct...


