Curated OER
Generating Points and Graphing
Students create a table of values to help them plot. For this algebra lesson, students plot their points on a coordinate plane creating a graph. They observe and analyze linear functions.
Curated OER
Linear Functions-Learn Your Lines
Students solve and graph linear equations. In this algebra lesson plan, students collect and plot data on a coordinate plane. They use the CBL and TI calculator to graph systems of equation.
Curated OER
Graphing Made Easy
Fourth graders discover the appropriate way to construct and analyze bar, line, picto, and circle graphs. They set up frequency tables and perform some statistical analysis (mean, median, and mode) on their data.
Curated OER
Graphing and the Coordinate Plane
Students learn about the Cartesian coordinate plane, understand the four quadrants of the Cartesian coordinate plane, and plot points on the plane. Students read coordinates for a point from a graph and give the ratio of rise over run...
Curated OER
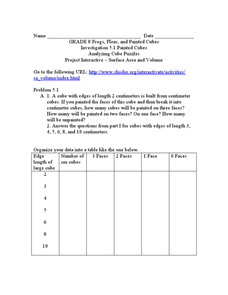
Analyzing Cubes
In this analyzing cubes worksheet, 9th graders solve and complete 6 different types of problems. First, they organize the given data into the table provided. Then, students study the patterns in the table and tell whether the pattern of...
Curated OER
Whose Line is it Anyway?
Students solve systems of equations. In this algebra lesson, students identify the domain and range of each function. They use the slope and y-intercept to graph each line.
Curated OER
Graphing Ozone Chemistry: Introduction
Learners discuss Ozone Chemistry. They do research on the subject. They graph their data. They analyze the economic impact of removing CFC's from the biosphere, and graph the worldwide production of CFC's since their discovery.
Curated OER
Analyzing Motion of a Tossed Ball
Students investigate the parameters involved with launching a basketball at an angle. In this motion lesson students predict and sketch graphs that show the motion of a ball toss.
Curated OER
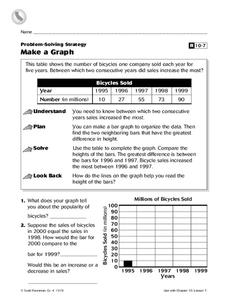
Make a Graph
In this graphs worksheet, 4th graders, after studying and analyzing a table on bicycles sold within several years, answer 2 short answer questions relating to the table.
Curated OER
Button Bonanza
Collections of data represented in stem and leaf plots are organized by young statisticians as they embark some math engaging activities.
Concord Consortium
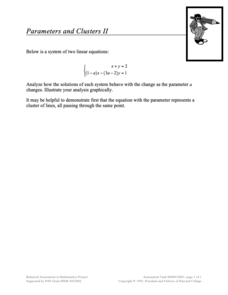
Parameters and Clusters II
Let's give parameters a second try. Scholars take a second look at a system of linear equations that involve a parameter. Using their knowledge of solutions of systems of linear equations, learners describe the solution to the system as...
Curated OER
Symmetric Secant
Mathematicians use a symmetric secant line to prove the derivative at a point. In this trigonometry lesson, students create secant lines on the navigator to analyze the derivative. They move the lines around and make observations.
Curated OER
Atlatl Lessons Grades 4-12: Lesson for Beginning Users of Atlatl
Sixth graders determine the mean, range median and mode of a set of numbers and display them. In this data activity students form a set of data and use computer spreadsheet to display the information. They extend of the process by...
Curated OER
Looking for More Clues
Fifth graders explore how to collect data and display it on a bar and circle graph.
Curated OER
Coordinates
In this coordinates worksheet, students analyze two maps and identify the coordinates of ten specific locations. Students plot sixteen points on a graph and check their answers online at the end of each exercise.
Curated OER
The Speed of Galaxy Q2125-431
In this speed of a galaxy instructional activity, students use a given equation for the speed of an object and they use the spectral lines for Hydrogen Alpha and Beta from the Seyfert galaxy to answer 6 questions. They determine the...
Curated OER
Simultaneous Equations for Circuit Analysis
In this worksheet, learners use Algebra to plot different solutions to equations and analyze schematics in order to answer a series of 25 open-ended questions about electrical circuits. This worksheet is printable and the answers are...
Chicago Botanic Garden
Micro-GEEBITT Climate Activity
A truly hands-on and inquiry based learning activity bridges all the lessons in the series together. Beginning with a discussion on average global temperatures, young meteorologists use real-world data to analyze climate trends in order...
Curated OER
Introduction to Functions
Learners explore functions, function rules, and data tables. They explore terms of linear functions. Students use computers to analyze the functions. Learners write short sentences to explain data tables and simple algebraic expressions.
Curated OER
Exploring Linear Equations And Scatter Plots - Chapter 5 Review
Young scholars complete rolling stocks experiment, and collect and enter data on the computer. They enter data on graphing calculators, complete scatter plot by hand with line of best fit, and discuss different graphing methods.
Curated OER
Midpoint of a Segment
Learners revisit midpoint and segments by graphing on the TI or computer. This activity can be done with pencil and paper, but is more interactive if it is done on a TI-navigator.
Polar Trec
Foraging for Fish in a Melting Arctic
How much do you know about the black guillemot of the Arctic region? With great background information, images, and a quick discussion, the class will learn all about the plight of the foraging seabird as they play a fun game. First,...
Noyce Foundation
Truffles
Knowing how to scale a recipe is an important skill. Young mathematicians determine the amount of ingredients they need to make a certain number of truffles when given a recipe. They determine a relationship between ingredients given a...
Curated OER
Dental Detectives
First graders explore the theme of dental health and hygeine. They make tooth loss predictions, count lost teeth, and graph tooth loss. In addition, they listen to dental health stories, read online stories, create spreadsheets, and play...


