Curated OER
Stemmin'-n-Leafin'
Learners make stem and leaf charts to determine the measures of central tendency using test score data. They analyze the data to draw inferences which they share with the class. They complete the associated worksheets.
Curated OER
Breakfast Cereal - How Nutritious Is Yours?
Students analyze the nutritional value of breakfast cereal in order to make an informed choice. They create a stem and leaf plot which analyzes the nutritional value of the cereal they eat on a regular basis. Students write a letter to...
Curated OER
TOPSY TURVY MAPS
Eighth graders use the data analyzer and motion detector to collect data and measure distances. They create topographic maps drawn to scale of a given setup and relate the concepts to the creation of historical ocean maps.
Curated OER
Let's Get Physical
Students collect data using the CBL. For this statistics lesson, students predict the type of graph that will be created based on the type of activity the person does. The graph represents heart rate depending the level of activity.
Curated OER
The 400-Meters Race
Students collect and graph data. In this algebra lesson, students describe, interpret and analyze data. They follow a 400 meters race and plot the coordinates of the course. They graph a line to represent the data of the course.
Curated OER
Motion Musing
Students investigate graphing a line. In this algebra lesson, students collect data on the path of a skateboarder. They collect how fast the board is traveling along a straight line and graph their results.
Curated OER
Atlatl Lessons for Grade 4
Fourth graders explore the weapons of the Aboriginal people. In this fourth grade math lesson, 4th graders create charts, tables, or diagrams to represent patterns and relations. Students investigate which dart length has the best...
Curated OER
Raisin the Statistical Roof
Use a box of raisins to help introduce the concept of data analysis. Learners collect, analyze and display their data using a variety of methods. The included worksheet takes them through a step-by-step analysis process and graphing.
Curated OER
Evidence of Change Near the Arctic Circle
Students analyze graphs and make conclusions about climate change. In this climates lesson students produce graphs and identify relationships between parameters.
Curated OER
Theobroma - Food of the Gods
Students discuss the history of cacao and its use in the production of chocolate. They analyze actual cacao pods and record their observations. Finally they create a five minute contour drawing of the cacao pod and seeds.
Curated OER
Investigation - Looking For Triangles
Seventh graders investigate a series of triangles, looking for patterns and generalizing what they have found. They analyze the pattern data and organize it into a table and graph. Students identify the relationship and discover the rule...
Curated OER
Endangered Species
Ninth graders graph data in order to compare the number of extinct species and a rise in human population. They analyze the data collected. Students are encouraged to infer the relationship.
Curated OER
Creating Climographs
Students chart statistical information on graphs, interpret the information and use it to explain spatial relationships, and identify the relationship between climate and vegetation.
Curated OER
Graphs and Functions
Students are introduced to plotting functions on the Cartesian coordinate plane seen several categories of functions, including lines and parabolas
Curated OER
Social Studies: Analyzing Massachusetts Immigration
Students investigate immigration in Massachusetts during the 1990's. They research a series of questions pertaining to immigration, including their experiences, obstacles, and countries of origin. They graph the five most prevalent...
Curated OER
Obstacles to Success: Misleading Data
Eleventh graders explore how data reported by country agencies can mislead the public intentionally or unintentionally. In this Cross Curricular activity, 11th graders analyze charts and graphs in order to draw conclusions. Students...
Curated OER
Cost analysis
For this Algebra I worksheet, 9th graders analyze a problem in which basic assumptions must be made about cost and demand for the product or item. Students use a graph to make predictions and determine the best price at which to sell an...
Curated OER
State Names: Frequency
Data grathers determine the frequency of specified data. They identify the frequency that specified letters occur in the names of all 50 states. They create stem-and-leaf plots, box-and-whisket plots and historgrams to illustrate the data.
CK-12 Foundation
Linear Programming: Bakers' Dilemma
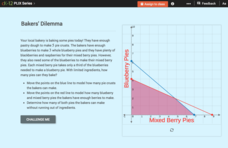
Place the pies in a line. Pupils create a graph of a system of linear inequalities to represent the number of pies a bakery can make. Learners analyze the vertices on the graph to determine the number of pies they can bake without...
Teach Engineering
Exploring Variables While Testing and Improving Mint-Mobiles (for High School)
Mint candies are good for more than just one's breath. Using basic materials such as mint candies, straws, index cards, and Popsicle sticks, scholars create race cars that meet a given budget as well as design constraints. They perform...
Curated OER
Ornithology and Real World Science
Double click that mouse because you just found an amazing lesson! This cross-curricular Ornithology lesson incorporates literature, writing, reading informational text, data collection, scientific inquiry, Internet research, art, and...
Curated OER
How's The Weather?
Students make a box and whiskers plot using the TI-73 graphing calculator. Each student would have their own calculator but they would work in small groups of two or three to help each other enter the data and make the plots.
Curated OER
Finding Equations
Students make equations from everyday data. They create a graph from the equations. Students predict and analyze the results. Students complete the second scenario on their own and turn in their handout.
Pennsylvania Department of Education
The Multiplicative Identity and Numbers Close to One
Pupils practice multiplying and dividing whole numbers by fractions. They study the multiplicative identity property that states that the product of any number and 1 is that number. They multiply whole numbers by fractions close to 1 and...


