Curated OER
Looking For Triangles
Learners solve problems with triangles. In this geometry instructional activity, students analyze shapes to find different triangles. They name the shapes created by putting triangles together.
Curated OER
Investigation of Timbre
Students design an experiment to analyze the timbre of different instruments. In this physics lesson, students analyze the missing quality in sound. They discuss their results in class.
Curated OER
MOSAICS
Visual arts lesson emphasizing pattern and design in individual student mosaics made with paper and reviewing line, shape, space, and color. The individual mosaics will be used to create a border for a group mosaic in another lesson.
Curated OER
A Comparison of Land and Water Temperature
Students use the NASA website's Live Access Server to create a graph of surface temperature at two locations on earth. They analyze the data and then answer specific questions provided in this lesson. They also examine and compare the...
Curated OER
Box and Whisker Plots
Seventh graders explore the concept of box and whisker plots. In this box and whisker plots lesson, 7th graders plot data on a box and whisker plot. Students discuss the mean, median, and mode of the data. Students discuss range,...
Curated OER
Collecting And Organizing Data
In this collecting and organizing data worksheet, students, with a partner, problem solve and calculate the answers to six mathematical word problems.
Curated OER
Fourteen Math Regent Exam Statistics Questions on Scatter Plots and Linear Regression
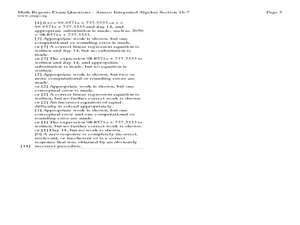
For this linear regression worksheet, students solve fourteen Math Regent Exam questions regarding scatter plots and linear regression. The solutions are provided.
Curated OER
Mathematics Within: Algebraic Patterns
Students discover patterns in linear equations by playing a dice game to collect data. They graph the data and analyze the patterns of the lines created by the data. The class then compares the individual graphs to evaluate the position...
Curated OER
Track's Slippery Slope
Middle schoolers graph data of sports figure running time using x-axis y-axis to find slope of trend line, mathematically find the interpolated and extrapolated values for data points. Using the information they make predictions.
Curated OER
The Bigger they Are . . .
Pupils do a variety of data analyses of real-life basketball statistics from the NBA. They chart and graph rebounding, scoring, shot blocking and steals data which are gathered from the newspaper sports section.
Curated OER
Lift Equation Problem Set
Pupils, after reading an explanation from a NASA Web-based textbook, demonstrate an understanding of the text by using it, along with FoilSim, to complete an activity to graph and interpret the lift equation.
Curated OER
Make Your Own "Weather" Map
High schoolers create their own "weather" map using data from x-ray sources. They analyze and discuss why it is important to organize data in a fashion in which is easy to read. They compare and contrast different x-ray sources using a...
Curated OER
Practicing Arithmetic
Students practice single operation arithmetic ranging from single digit addition to long division of decimals or real numbers using Graphit. They use data sets and rules to graph ordered pairs.
Curated OER
An Apple A Day
Learners create a graph that showcases their pick for favorite kind of apple. Students are given samples of a variety of apples to determine their favorite in a taste test. They a create a tally chart of favorite kinds apples and use a...
Curated OER
You Gotta Have Heart
Ninth graders investigate the concept of relations and interpret graphs and tables. They analyze given data and look for a pattern to determine if the numbers represent a function. Students practice solving scientific word problems that...
Curated OER
Confusing Colors!
Fourth graders collect data, graph their data, and then make predictions based upon their findings. They's interest is maintained by the interesting way the data is collected. The data collection experiment is from the psychology work of...
Curated OER
A Closer Look at Voting Patterns
Students examine the importance of voting. They analyze voter turnout graphs, conduct research, list the benefits and costs of voting, and write a paper that describes ways to increase voter participation.
Curated OER
Math League Baseball: Five Week Project
Eighth graders analyze how to use statistics, change fractions to decimal, and graph their statistics. They draft players from Major League Baseball eams and chose on player for each position, including 3 oufielders and one designated...
Curated OER
Data Shuffle
Middle schoolers find an advertisement or newspaper using charts or graphs. They create another graph using the same information in a different format. They write a comparison of the two graphs.
Curated OER
Where's the Beach?
Students use beach profile data to analyze how erosion and sediment transport changed seashore slopes. In this geology lesson, students plot the data provided and analyze erosion patterns. They also assess coastal erosion management...
Curated OER
Curveball vs. Fastball
Students graph the relationship between the release point and the final position of curveballs and fastballs thrown by both right and left handers given a constant speed, and explain the relationships illustrated by the graphs of data.
Curated OER
2D Kinematics w/ String Racers
Students calculate the speed of string racers. In this physics lesson plan, students measure the time in several trials and get the average. They graph their results using a spreadsheet.
Curated OER
Geometry and Symmetry
Students examine tessellations and their geometric properties. The lesson plan and discussions may be used to develop students' understanding of polygons and symmetry as well as their ability to analyze patterns.
Curated OER
pH Testing
Students explore the use of variables in the scientific method. They identify the dependent and independent variables through pH testing. Students construct graphs of their data and analyze their findings.


