American Statistical Association
Scatter It! (Using Census Results to Help Predict Melissa’s Height)
Pupils use the provided census data to guess the future height of a child. They organize and plot the data, solve for the line of best fit, and determine the likely height and range for a specific age.
Benjamin Franklin High School
Saxon Math: Algebra 2 (Section 3)
In this third of a twelve-part series, the focus moves from using matrices to solving systems of equations with substitution and elimination, including more than two dimensions and variables in equations, and analyzing statistical data....
Teach Engineering
Applications of Linear Functions
It's not so straightforward — lines can model a variety of applications. Pupils experience linear relationships within the context of science, including Hooke's and Ohm's Laws. Class members got a taste of motion and speed from the...
CCSS Math Activities
Smarter Balanced Sample Items: 8th Grade Math – Target D
Can learners determine solutions associated with lines? A slide presentation contains sample items for the Smarter Balanced 8th grade math Target D covering solving linear equations and systems of linear equations. Items illustrate the...
EngageNY
Secant and the Co-Functions
Turn your class upside down as they explore the reciprocal functions. Scholars use the unit circle to develop the definition of the secant and cosecant functions. They analyze the domain, range, and end behavior of each function.
Curated OER
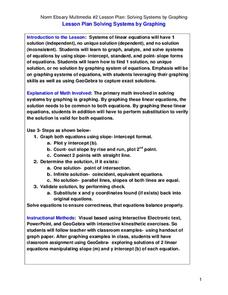
Solving Systems by Graphing
Students solve systems of equation through graphing. In this algebra instructional activity, students solve linear equations and analyze the result to figure out if there is one solution, no solution or infinitely many solutions. They...
Curated OER
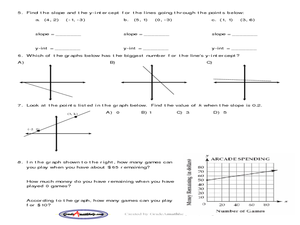
Analyzing Equations Through Slope and Y intercepts
Students analyze equations using the slopes and intercept. For this algebra lesson, students graph equations give the slope and y intercepts. They are also asked to identify the slope and y intercept from a given graph. They solve real...
Curated OER
Analyzing Equations Through Slope and Y intercept
Students analyze equations using the slope and y-intercept. In this algebra lesson, students identify the slope using a and the intercept using m. They graph linear equations based on the slope and intercept.
Curated OER
Slopes of Lines
Students examine a graph and relate it to the real world situation it depicts. They investigate changes in an equation and the appearance of a line. They investigate the connection between the graph of a situation and the meaning of the...
Curated OER
Download and Analyze
Students download information from a NASA website into a database. They transfer it to a spreadsheet by completing the information and analyze the information. They determine temperature averages, mode, and graph the results. They write...
Curated OER
AnaLyzing Equations Through Slope and Y Intercept.
Learners analyze and solve linear equations. In this algebra lesson plan, students solve inequalities using the slope and y intercept. They rewrite word problems into algebraic equations and solve for the unknown.
Curated OER
Storybook Character Graph
First graders dress as their favorite storybook character. They draw a self-portrait, then place the drawing on a graph.
Curated OER
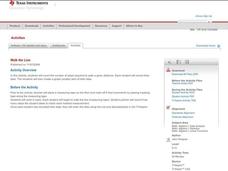
Walk the Line
Learners create constant speed versus motion graphs. They will perform linear regressions on their data to describe the graphs mathematically.
Curated OER
Graphing the Past Using Today's Technology
Eighth graders research statistical data regarding their current social studies unit. They write questions about the measures of central tendency, collect and analyze the data, insert the data into a spreadsheet, and generate graphs.
Curated OER
Intersecting Lines and Vertical Angles
Pupils identify and define intersecting lines and vertical angles. They draw two intersecting lines and measure one pair of vertical angles. Learners will also move a line to change the angles of a figure and describe the changes in the...
Curated OER
Perpendicular Bisector of a Line Segment
High Schoolers investigate the perpendicular bisector of a line segment. They use Cabri Jr. to construct the perpendicular bisector of a segment. The dynamics capabilities of Cabri Jr. allow your learners to observe the lengths of the...
Curated OER
Graphing
Seventh graders identify the different graphs used in science. In this graphing instructional activity, 7th graders analyze the three kinds of graphs. They construct a graph that best describes a given data.
Curated OER
Graph and Compare the Adventure's Temperature Vs. Local Temperature
Students explore the concept graphing data. In this graphing data lesson, students use weather data from their local weather and some other city and graph them. Students plot the local weather vs. another city. Students record...
Curated OER
Fossil Fuels and Its Effects On The World
Students explore the effects of a declining fossil fuel system would have on the world. They read the line graph and other information to answer questions about fossil fuels. Students use mathematics to analyze graphical data and...
Curated OER
Graphing Fun
First graders analyze objects and make a graphing picture to analyze the data. In this graphing lesson, 1st graders complete an object graph assessment, a picture graph assessment, and a bar graph assessment to analyze their given objects.
Curated OER
Line Best Fit
Learners identify the line of best fit. In this statistics lesson, students analyze graphs and plots to identify positive, negative or no correlation. They find the line of best fit for different scatter plots.
Curated OER
Graphing and the Coordinate Plane
Students examine the four quadrants of Cartesian coordinate plane. They play maze games and coordinate games to discover how to read and plot points on the plane. Students plot points on the coordinate plane and examine the ratio of...
Curated OER
Cinco De Mayo
High schoolers make a graph identifying the immigration of Mexicans to the US. In this algebra lesson, students practice graphing as they review different trends in immigration over the past 100 years. They interpret and analyze their...
Curated OER
Getting Started with the TI-Navigator™ System: What's My Line?
Learners analyze linear functions in this algebra instructional activity. They explore the meaning of slope and the slope-intercept form of a line as they investigate the effect changing parameters on the graph of a linear function.


