Curated OER
Censusmania
Students understand how the census can reveal information about people and history. They create their own census.
Curated OER
Completing University
Students analyze the pros and cons of completing a 4 year school. In this statistics lesson plan, students complete surveys and use E-STAT to graph their data. They learn to plot and build diagrams.
Curated OER
Enquiry 1: Introduction
Students explore war memorials from the First World War. After visiting a local war memorial, students research the soldiers listed. As a class, they discuss the the impact of the war on their community. Students research their...
Curated OER
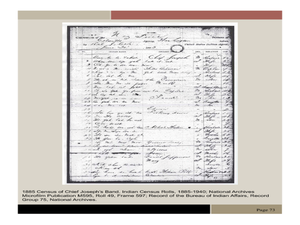
Chief Joseph and the Nez Perce
Eleventh graders explore the life of Chief Joseph and Nez Perce. In this US History lesson, 11th graders analyze paintings and photos detailing the flight of Nez Perce. Students create a narrative newspaper article based on their...
Curated OER
Progress Amidst Prejudice: Portraits of African Americans in Missouri, 1880-1920
Young scholars explore and analyze a database of historical portraits of an African American family of the late 1800's. They trace the migration of one of the African Americans as he/she migrates toward urban areas.
Curated OER
It's Your Life
Students make a multiple line graph showing income levels for each education level for the past 8 years and the number of people for each ethnic group and gender is compared within each education level.
Curated OER
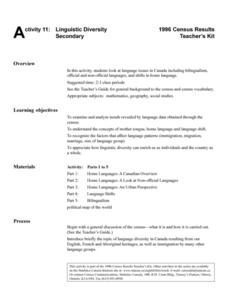
Linguistic Diversity Secondary
Don't be scared off by the title! Read this information packet with your class, or send them off on their own. After each section, you'll find a series of comprehension questions. Great preparation for state testing!
Curated OER
Population Pyramids
Young scholars explain the significance of population trends on world regions. They define relevant population vocabulary and examine age-gender patterns at various scales.
Science Education Resource Center at Carleton College
Serc: The Digital Divide: A Data Analysis Activity Using Subtotals
A lesson plan that includes a PowerPoint learning module for students. The purpose of the lesson is to teach how to use Excel to analyze a large amount of data, in this case from the US Census. The example being used is the accessibility...


