Curated OER
Weather Whys- Cloud Watching Journal
Students examine how natural processes change the earth by identifying their local water cycle. Individual students complete a cloud journal over a specific period of time. They observe clouds daily and take photographs of the clouds...
Curated OER
Sunrise-Sunset
Students gather data, make and share predictions about the time of sunrise ans sunset in their area. Patterns are analyzed and shared with students from other areas.
Curated OER
Chemical Weathering
Students measure the effect of water temperature on the rate of a chemical reaction, similar to the interaction of a weak acid and carbonate rock, using hot water and effervescent antacid tablets.
Curated OER
Worm Weather Predicted
Students examine worm habitats. In this animal habitats lesson, students participate in a lab activity that requires them to explore the adaptations that earthworms make to their environment.
Curated OER
High Mountain Retreat
Students explore and analyze atmospheric conditions for a high mountain retreat. They examine the relationship between altitude, atmospheric pressure, temperature and humidity at a particular location. In addition, they write reports...
Curated OER
Calculating Profits from Selling Virtual Lemonade
Students set up and collect data for a virtual lemonade stand. In this entrepreneurship, economics, and technology lesson, students purchase ingredients, determine costs, and set up a virtual lemonade stand. Students consider weather...
Curated OER
Sunrise/Sunset
Students apply data from a weather-related website to predict patterns in the sunrise and sunset.
Curated OER
Reading Satellite Images
Students analyze satellite images. For this astronomy lesson, students examine 3 satellite images in order to understand how satellite images are taken and what they can teach scientists.
Curated OER
What Plants Need in Order to Survive and Grow: Soil
Students conduct an experiment to evaluate whether plants need soil to survive and grow. They plant two seeds, one with soil and one without, make predictions, and record and analyze the seed germination results on a worksheet.
Ohio Department of Education
Observe Then Infer
Upper elementary scientists learn that observations made can lead to inferences. They rotate through six weather-related stations that challenge them to make observations and then draw inferences from their observations. A...
Curated OER
Make Your Own "Weather" Map
Students develop and apply a variety of strategies to solve problems, with an emphasis on multi-step and non-routine problems. They acquire confidence in using mathematics meaningfully.
Curated OER
Will There Be Ozone Tomorrow
Young scholars collect and analyze real time data. They make comparisons and determinations about the status of ozone in their local area and predict the Ozone level for the next day
Curated OER
Coral Bleaching in the Caribbean
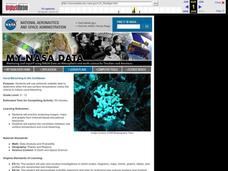
Students use authentic satellite data on the NASA website to determine when the sea surface temperature meets the criteria to induce coral bleaching.
Curated OER
What is a Cloud
Third graders study clouds and how they are formed. They write acrostic poems about clouds and analyze and graph temperature data collected during varying degrees of cloud cover.
Curated OER
Manage Soil
Learners identify and classify soil ypes according to data on the soil triangle. Given examples, students identify soil conservation practices, using criterion assessment instrument. When giving a case situation involving soil...
Curated OER
Surface Area and Measuring
Tenth graders explore volume and surface area through percentages. In this geometry lesson plan, 10th graders analyze the surface area of two and three dimensional shapes, then use percents and ratio to compare the two.
Curated OER
El Nino
Learners explain what El Nino is, where it is located and how it is created. They describe the weather changes caused by El Nino. They draw the patterns of El Nino on a world map. They predict economic effects El Nino has on the areas it...
Curated OER
Microclimates of Our School
Students read the story "Weslandia" by Paul Fleischman, define the term microclimate, gather and record data in various places on school grounds to establish the presence of difference microclimates, analyze and compare microclimates,...
Curated OER
Water Cycle Bag
Students enclose water in an airtight bag and leave it in a warm area to view the water cycle. In this water cycle lesson plan, students observe evaporation, condensation, and precipitation. They then discuss what they learned about the...
Curated OER
Conditions at Sea
Young scholars examine wave formation. In this wave lesson, students discover how waves are formed and how the weather at sea is predicted. Young scholars study ocean vocabulary and understand the Beaufort Wind Force Scale.
Curated OER
The Hudson's Ups and Downs
Fifth graders practice interpreting line graphs of the Hudson River water levels to assess the tides and tidal cycles in the estuary. They explore how weather can affect water levels and tides and observe that high tides and low tides...
Curated OER
Wind Energy
Students explore wind energy by making a pinwheel to model a wind turbine. They experiment with their turbine by placing it in different locations for optimal energy.
Curated OER
Environment: Climate Change
Students explore climate change and the greenhouse effect. Using provided definitions, they assess local weather conditions and analyze long term climatic data for their areas. Once they explore the concept of and connection between...
Curated OER
How Soft or Hard is Your Water?
Students test samples of water to determine how a chemical water softener affects water's ability to form suds. After collecting their data and analyzing their results, students answer follow-up questions about their lab.


