NASA
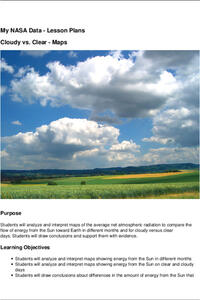
Cloudy vs. Clear - Maps
Find out the science of how clouds keep Earth cooler on hot days. Using guided discussions, investigators analyze and interpret maps of how much solar energy Earth receives at different times of the year. Participants draw conclusions...
Texas Instruments
Endothermic and Exothermic Processes
Students investigate temperature using the TI. In this chemistry lesson, students analyze the change in temperature, as chemicals are dissolved in water. They analyze data collected using the CBL 2.
Curated OER
Tropical Atlantic Aerosols
Students analyze NASA data from the Multi-angle Imaging Spectroradiometer. In this NASA data lesson plan, students access an assigned website to examine information from the MISR on the Terra Satellite. They determine how desert dust...
Curated OER
MAISA and the REMC Association of Michigan
Students complete online research to study geography's impact on weather. In this geography and weather lesson, students research weather in their city for ten days using an online website. Students bookmark the site, enter data into a...
National Wildlife Federation
I Speak for the Polar Bears!
Climate change and weather extremes impact every species, but this lesson focuses on how these changes effect polar bears. After learning about the animal, scholars create maps of snow-ice coverage and examine the yearly variability and...
National Wildlife Federation
Ghost Town
Around 93 percent of the reefs on Australia's Great Barrier Reef have been bleached, and almost one quarter of them are now dead. Scholars research the sea temperatures, especially around the areas with coral reefs, to make connections...
Curated OER
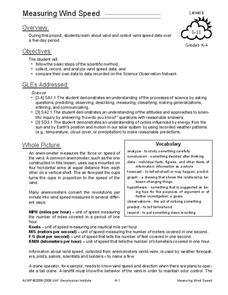
Measuring Wind Speed
Students study wind speed and collect wind speed data. In this wind speed lesson, students visit a website to learn about the local wind speed forecast for their week. Students discuss wind and wind speed. Students collect wind speed...
Curated OER
Weather, Migrations, and Plants
Students research the effects of day-to-day weather on animal migrations, plant growth and other seasonal events. They consult maps, observe and record local conditions, keep journals and use their collected data check hypotheses.
Curated OER
Become the Meteorologist
Seventh graders analyze the data from Hurricane Tracking maps. In this earth science lesson, 7th graders plot data points on their maps and predict where the storm will most likely hit. They compare their prediction with the actual storm...
NASA
Comparing Temperature and Solar Radiation for Common Latitudes
There's snow much to learn! Excited individuals use real-world data to discover how latitude affects the odds of a snow day. Scientists compare latitude, solar radiation, and temperature using NASA data for several locations....
Curated OER
Weather Watch
Students complete a series of lessons in which they study daily weather patterns and examine extreme weather conditions. They complete activities that range from visual observation of daily weather to building a weather station and...
Curated OER
Do the Elephants Need Sunscreen? A Study of the Weather Patterns in Etosha
Students analyze the weather patterns in Namibia. They create a graph of the yearly temperatures and use the internet to gather information. They discuss how the weather goes in cycles in the area.
Curated OER
Weather in Your City
Students observe weather conditions of a particular city. Multiple intelligences are explored within this lesson. They locate their particular city on a United States map. Each student writes about their discoveries in his/her journal...
Discovery Education
Sonar & Echolocation
A well-designed, comprehensive, and attractive slide show supports direct instruction on how sonar and echolocation work. Contained within the slides are links to interactive websites and instructions for using apps on a mobile device to...
National Wildlife Federation
Climate Solutions – A Call to Action!
The final lesson in the 21-part series on climate change focuses on energy solutions to the consumption problem. Using data specific to their school, pupils make recommendations, follow up on actions, and carefully track progress....
Curated OER
Using Computers for Statistical Analysis of Weather
Students use temperature, cloud cover and other weather data from the S'COOL website to statistically analyze weather around the country. They use computers to calculate and graph standard deviations, means and modes of the weather...
Curated OER
I'm a Weather Watcher Watching plants grow by......my,my,my
Students investigate how weather affects how plants grow. They collect data on weather and plant growth for a week and display the data on a graph. For a culminating experience they design a movie using software that shows plant growth...
Curated OER
Weather and Atmosphere
Seventh graders explain the layers of the atmosphere. They identify the causes of air pollution. They analyze real world weather data. They explore and describe clouds. They develop models to explain atmosphere and weather.
Curated OER
Effects of Temperature, Deviation on Climate
Students collect and record data for a given city. They calculate standard deviation of temperature and analyze the impact of climate changes on a city's and culture.
Curated OER
"Weather" or Not?
Young scholars complete a three week unit about weather and how it affects our behavior. They read and discuss various books related to weather, conduct an experiment about the tilt of the earth, plan a field trip based on temperature,...
Rainforest Alliance
Climate Educator Guide
Climate change is a hot topic in the news. Class members examine carbon dioxide data to analyze trends of our atmospheric makeup over time. They also discuss climate and climate change, and determine how these changes are affecting life...
Curated OER
Global Warming Statistics
Students research real-time and historic temperature data of U.S. and world locations, and analyze the data using mean, median, and mode averages. They graph the data and draw conclusions by analyzing the data. A spreadsheet is used to...
Curated OER
Environment: Wild Wind Direction
Students examine the different types of wind patterns. Using common materials, they construct weather vanes to measure and record wind direction over a two-week period. After analyzing the data, they draw conclusions about the...
Curated OER
Hurricane Frequency and Intensity
Students examine hurricanes. In this web-based meteorology lesson plan, students study the relationship between ocean temperature and hurricane intensity. They differentiate between intensity and frequency of hurricanes.


