Curated OER
Wonderful, Wild Weather
Students study the different types of weather, how it affect what they wear, and how it is related to the seasons. They compare the seasons and tell how they prepare for the change in seasons. They design a creative presentation about...
Curated OER
Severe Weather - Deciding Where to Live
Students recognize the variety and frequency of severe weather occurrences. They research the type of severe weather that may occur in their area as well as determine the frequency of occurrence.
Curated OER
Isolines on a Weather Map
Ninth graders explore weather by analyzing maps. In this temperature lesson, 9th graders view black and white weather maps of locations in which the weather changes often. Students identify the isolines used on the maps and utilize the...
Curated OER
Tracking Weather Over Time
Students gather, analyze and interpret data. They explain scientific inquiry. They plot points on a map and report information from a spatial perspective.
Curated OER
Seasons and Cloud Cover, Are They Related?
Students use NASA satellite data to see cloud cover over Africa. In this seasons lesson plan students access data and import it into Excel.
Curated OER
Graphing the Facts
Middle schoolers investigate the correlation between our planet's weather and solar activity. They analyze and discuss data regarding the solar activity cycle, graph annual precipitation and temperature averages over a period of 100...
Curated OER
Probability With a Random Drawing
Students define probability, and predict, record, and discuss outcomes from a random drawing, then identify most likely and least likely outcomes. They conduct a random drawing, record the data on a data chart, analyze the data, and...
Curated OER
Moisture Advection
Young scholars analyze meteorological data and arrive at conclusions using animations of dewpoint temperatures and winds. They view an animation and determine the preferred location(s), if any, for the advection of moisture into the...
Curated OER
Meteorological Predictions
Students make a link between prediction and hypothesis in math and science. Based on data collected over one week, students evaluate the predictions of local weather forecasters, compare the predicted outcomes to the actual weather...
Curated OER
WEATHER SATELLITE PREDICTION PROJECT
Learners compile weather satellite data from three satellites for one month, obtain weather reports and data from professionals, then create a document with predicted results.
Curated OER
Observing Fall Migrants
Students keep a detailed data collection log of the different types of monarch behavior. They track the weather conditions daily and link it to the migration of the monarchs. They summarize their data using either a graph or a computer...
Curated OER
Phenomenal Weather-Related Statistics
Eighth graders research, collect and interpret data about weather statistics. They record that data on spreadsheets. they create Powerpoint presentations on their individual or group research.
Curated OER
Blowin' In The Wind
Learners predict and hypothesize the reasons for wind movement. After viewing a video, they describe the effects of a high and low pressure system and what makes the wind blow. In groups, they construct instruments that measure air...
Space Awareness
Continental Climate and Oceanic Climate
There's nothing better than a cool breeze blowing in from the ocean. Scholars explore how water affects change in temperature using a hands-on experiment on climate. They use measurement tools to compare the continental and oceanic...
Curated OER
The Hudson's Ups and Downs
Even rivers have tides. Older elementary schoolers will discuss the Hudson River and how weather, water craft, and the ocean cause tidal fluctuation. They will examine a series of line graphs that depict tidal fluctuation, then analyze...
Curated OER
The Mysteries of El Nino: How Much do We Really Know?
Seventh graders investigate the causes and effects of El Nino and explore its global impact on weather related occurrences through this series of activities.
Curated OER
Learning Lesson: Ups and Downs
Students use the internet to find the air temperatures in their area. They create a graph based on the data. They analyze the data and examine tips for avoiding extreme weather.
Curated OER
Historical Temperatures
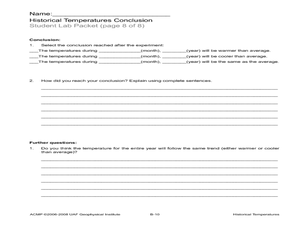
Learners research historical regional temperatures for their current season. In this historical weather lesson, students conduct weather station and Internet research to learn about historical regional temperatures. Learners collect and...
Curated OER
Does Cloud Type Affect Rainfall?
Student uses MY NASA DATA to obtain precipitation and cloud type data. They create graphs of data within MY NASA DATA. They compare different cloud types as well as precipitation types. They describe graphs of the precipitation and cloud...
Curated OER
Graphics Creation and Statistical Interpretation: Relating Local Economics and the Global Environment
Students apply statistics, and graphical interpretation to economics, the environment and populations. In this statistical instructional activity students construct graphical displays and classify data.
Curated OER
Backyard Birds: Who's Who Out There?
Students practice techniques of field observation and data-gathering while studying local bird population, describe ecosystem as complex combination of elements, which can affect or be affected by each other, and determine effects of...
NASA
Down to Earth
There are only 10 types of people in the world: those who understand binary and those who don't. The lesson includes four activities in which students learn binary, convert binary to images, understand CCD arrays, and interpret...
Curated OER
Evidence of Change Near the Arctic Circle
Students analyze graphs and make conclusions about climate change. In this climates lesson students produce graphs and identify relationships between parameters.
NASA
Radiation Shielding on Spacecraft
Here is a terrific science lesson for your elementary schoolers. In it, learners analyze different materials to simulate space radiation shielding on spacecraft, then select the best material to use to build one. This is a classic...


