Curated OER
Worksheet for Analysis of a Map
In this primary source analysis worksheet, students respond to 6 short answer questions that require them to analyze the maps of their choice.
Curated OER
Storm Clouds-- Fly over a Late Winter Storm onboard a NASA Earth Observing Satellite
Students study cloud data and weather maps to explore cloud activity. In this cloud data lesson students locate latitude and longitude coordinates and determine cloud cover percentages.
Curated OER
Introduction to Maps
Young scholars investigate a variety of maps to explain what each one is used for.
Science 4 Inquiry
An Investigative Look at Florida's Sinkholes
In May of 1981, the Winter Park Sinkhole in Florida first appeared and is now referred to as Lake Rose. Scholars learn about the causes of sinkholes through an inquiry project. Then, they analyze recent data and draw conclusions to...
Chicago Botanic Garden
Historical Climate Cycles
What better way to make predictions about future weather and climate patterns than with actual climate data from the past? Young climatologists analyze data from 400,000 to 10,000 years ago to determine if climate has changed over time....
Curated OER
Air Pollution: What's the Solution?
This air pollution worksheet provides a step-by-step process for gathering data about the ozone and weather. Amateur meteorologists enter data for 3 days including the air quality, the temperature, the wind speed, any particular events...
Curated OER
What's Up? Clouds and Your Weather
Seventh graders identify clouds and the weather that is associated with them. In this weather lesson students work in groups and design their own weather map.
Curated OER
This Week's Weather
In this weather worksheet, students record the weather for the week on individual US maps and include highs and lows, fronts and precipitation. They give all weather facts for the week and analyze the weather systems and trends of the week.
Curated OER
Mapping Community Values
Students discuss the origin of various maps focusing on the values behind them. Students also explore how human needs and geography influence community settlement patterns. Students extend learning by creating and mapping their own ideal...
Curated OER
Weather in Your City
Students observe weather conditions of a particular city. Multiple intelligences are explored within this lesson. They locate their particular city on a United States map. Each student writes about their discoveries in his/her journal...
Curated OER
Weather, Data, Graphs and Maps
Students collect data on the weather, graph and analyze it. In this algebra lesson, students interpret maps and are able to better plan their days based on the weather reading. They make predictions based on the type of clouds they see.
Curated OER
Air Pollution:What's the Solution?-Weather's Role
In this air pollution and weather worksheet, learners collect data using an online animation to determine the air quality at given times along with the wind speed and temperature in a particular city. Students make 3 bar graphs using the...
Curated OER
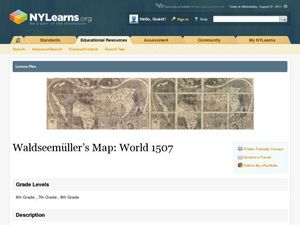
Waldseemüller’s Map: World 1507
Learners take a closer look at historical maps. For this primary source analysis lesson, students examine the first world map produced by Martin Waldseemuller. Learners complete the included map analysis worksheet and then write letters...
Curated OER
Weather Forecasting: From Then to Now
Eighth graders review the history of weather forecasting. In this earth science lesson, 8th graders identify the different tools used in forecasting weather. They explain why it's important to know the weather.
Curated OER
Comparing Temperatures and Latitudes
Eighth graders collect weather data from a variety of cities at the same latitudes, but on different continents. They organize data using spreadsheet program, generate graphs, and incorporate into a word processing document. Students...
Curated OER
What Do Maps Show?
Students discover the uses for various types of maps. In this geography skills lesson, students discuss the type of maps that exist and what their individual features are. Students then practice using different types of maps.
Curated OER
Introduction to Maps
Learners develop their map skills. In this geography lesson, students participate in an activity that requires them to survey their social studies book in order to find different types of maps and purposes for their uses.
Association of American Geographers
Project GeoSTART
Investigate the fascinating, yet terrifying phenomenon of hurricanes from the safety of your classroom using this earth science unit. Focusing on developing young scientists' spacial thinking skills, these lessons engage learners in...
Curated OER
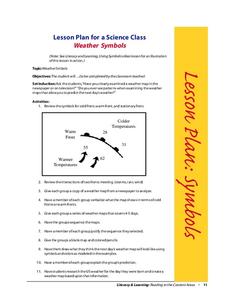
Weather Symbols
Students study weather symbols. In this weather symbols lesson, students review the symbols for cold, warm, and stationary fronts. Students use a weather map to study the weather symbols, complete a weather illustration and prediction...
Curated OER
Meteorologist for the Day
Fourth graders examine the symbols used on weather maps. They analyze a newspaper weather forecast and identify and discuss the various symbols used on the map. Next, they prepare a weather map for their own city using the symbols...
Curated OER
Weather, Migrations, and Plants
Students research the effects of day-to-day weather on animal migrations, plant growth and other seasonal events. They consult maps, observe and record local conditions, keep journals and use their collected data check hypotheses.
Curated OER
Make Your Own "Weather" Map
High schoolers create their own "weather" map using data from x-ray sources. They analyze and discuss why it is important to organize data in a fashion in which is easy to read. They compare and contrast different x-ray sources using a...
Curated OER
Waldseemuller's Map: World 1507
Seventh graders analyze various maps. In this Geography lesson, 7th graders create a large map as a whole class. Students write a letter to Mr. Waldseemuller.
NASA
Cloudy vs. Clear - Graphs
Explore the link between solar energy and cloud cover using real data from NASA from China! Future climatologists analyze and interpret graphs of solar energy on clear and cloudy days using a literacy cube. Investigators draw conclusions...


