Curated OER
The Emergence and Evolution of the Cuneiform Writing System in Ancient Mesopotamia
Middle schoolers explore the parallel development and increasing complexity of writing and the growth of civilization in the Tigris and Euphrates valleys in ancient Mesopotamia.
Alabama Learning Exchange
The Water Cycle
Learners identify the stages of the water cycle. They listen to the book "Magic School Bus: Wet All Over," examine the Build Your Own Water Cycle website, predict and measure the amount of water in a jar for a week, and read a short play...
Curated OER
When Ants Fly
Here is a great lesson on constructing line graphs. Learners identify common characteristics of birds, ants common needs of all living things. They also write a story from the perspective of an ant or a bird that has lost its home and...
Curated OER
Data Collection and Presentation
Middle and high schoolers collect and analyze data from four different activities. The activities include information about classmates, tallying colors of cars in a parking lot, stem and leaf plots, and making a histogram from winning...
Curated OER
Build a Bar Graph
Learners discover how to use bar graphs. They will gather and organize specific data in order to put it into a bar graph. Then they will answer several questions based on the information they have graphed.
Curated OER
Measuring Volume/Capacity Using the Metric System
There is more than one way to measure an amount, as learners discover by applying multiple measurement tools in these activities. Centimeter cubes, cylinders, beakers, and measuring cups are used to find the volume of regular and...
Curated OER
Hot and Cold Colors
Students experiment with the color and solar energy absorption. In this color and solar energy absorption lesson plan, students spend two days discussing and experimenting with the concept of energy absorption. They paint cans with...
K12 Reader
Displaying Data
It's important to learn how to display data to make the information easier for people to understand. A reading activity prompts kids to use context clues to answer five comprehension questions after reading several paragraphs about...
Curated OER
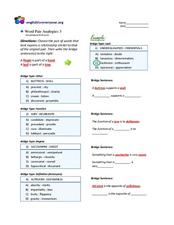
Word Pair Analogies 3
Designed for English language learners, but a good practice activity for all kids, this resource focuses on SAT words like saccharine, pragmatic, and precept. Effective scaffolding is provided here, as the last two questions require the...
Sargent Art
Rainsticks
This rainstick instructional activity isn't just about making art; it's about understanding Native American symbols and culture. Kids read about the use of rainsticks and why specific symbols were used to decorate them. They then make...
Mobile Education Store
Rainbow Sentences
Learners who struggle with grammar, foundational reading skills, and sentence composition can learn how to write proper sentences using an app that relies on research-based practice. It uses a color-coded formula that had been proven to...
Curated OER
Gold-Worthy Ideas for the Upcoming Games
Gather some ideas for bringing the Winter Olympics into your classroom.
Virginia Department of Education
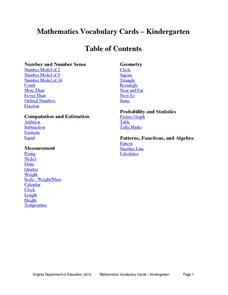
Mathematics Vocabulary Cards - Kindergarten
Enhance your math lesson with a series of pictures that illustrate different math concepts. The vocabulary includes a variety of ideas and pictures including fractions, ordinal numbers, picture graphs, and number lines.
Virginia Department of Education
Mathematics Vocabulary Cards - Grade 2
Augment your math curriculum with posters detailing several concepts important to second grade math. Each poster features one math term from geometry, measurement, probability and statistics, computation and estimation, numbers and...
Houghton Mifflin Harcourt
Unit 3 Math Vocabulary Cards (Grade 3)
Looking for math vocabulary cards for third graders? Use a set of 15 math cards with terms associated with graphing. The top half of each sheet has the vocabulary word printed in bold text, and the bottom half includes the word's...
Curated OER
Algebra 2 Desmos Graphing Project
Encourage class members to get creative with functions. Pairs write their names and draw pictures using a graphing application with a collaborative graphic project. The resource provides the requirements for the project, as well as a...
Syracuse University
Ancient World Writing System
Most twenty-first century pupils don't know how to interpret cuneiform. Examining images of cuneiform and papyrus writing and using a chart and Venn diagram, young historians extrapolate what life may have been like for people who lived...
Curated OER
Statistics of Mars
Students explore the concept of central tendencies. In this central tendencies lesson plan, students sort M&M's or Skittles based on color. Students graph their results. Students find the mean, median, and mode of their data.
Curated OER
Virtual Winter Count
Learn more about the North American Plains Indian tribes and their unusual methods of recording historical events. Learners examine the winter count, a custom by which these groups illustrated information after each winter passed. They...
Curated OER
Mmm, Mmm, M&M's
Here is another version of the classic M&M math lesson. In this one, upper graders utilize the ClarisWorks Spreadsheet program in order to document the data they come up with from their bags of M&M's. After making their initial...
Curated OER
What's Data?
Students get the opportunity to investigate the concept of data collecting. They explore how to tally and read a bar graph. Vocabulary about data is also be included. At the end of the lesson, individual students collect data independently.
Curated OER
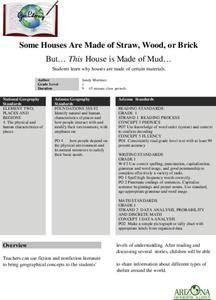
Some Houses Are Made of Straw, Wood, or Brick: But... This House is Made of Mud...
First graders read and discuss several stories. They share information about different types of shelter around the world. They explain that lifestyles and shelter depend very much on where people live and how they use the resources...
Curated OER
Garbage Plants
Students create plants out of garbage. They identify items that can be recycled and discuss natural resources. They share their creation with the class.
Curated OER
Graph the Results: Applesauce Taste Test
Students work together to make applesauce following specific directions. They taste each applesauce and graph the results based on the taste test. They also use the internet to create an online graph.


