Curated OER
Jack and the Beanstalk Math
Students listen to Jack and the Beanstalk and determine what they think are the most common words. In this Jack and the Beanstalk lesson, students reread the story, count the words they chosen and graph those words. Students graph the...
Curated OER
Where the Wild Things Are
Students explore the role of gargoyles in New York City architecture as a starting point to considering architectural structures in their city. They create designs that illustrate ways in which those local structures may be enhanced by...
Curated OER
Graphing With Candy
Students gather information and interpret the results using a tally chart, a table, and a bar graph.
Curated OER
Probability Popsicle Pop-ups
Fourth graders decorate and use popsicle sticks as manipulatives to assist with their learning of probability. They utilize a worksheet imbedded in this plan to organize the results of their experiment. They make a stem and leaf plot...
Curated OER
Does One Tree a Forest Make?
Students take a walk around the schoolyard looking at and identifying the trees. One leaf for each tree is collected. A chart is developed that represents the population of trees on the school ground. They keep journals and write an essay.
Curated OER
Creating a Graph
Students brainstorm favorite things to do during the summer. They survey classmates to collect data, arrange it in a chart, and create graphs using ClarisWorks.
Curated OER
HEART THROBS
Learners predict what might happen to their pulse rates after physical exertion and then make conclusions about the effects of physical activity on pulse rates.
Curated OER
Drawing Bugs Game
Second graders explore probability by playing a drawing game with dice. After they roll a die, they draw a tree diagram to illustrate each of the possible outcomes.
Curated OER
Moving On Up!
Students complete a game-like simulation to determine a career and salary. In groups, they collect information and decide what is the "best" city in which to live. They create a monthly budget for their "best" city based on salary from...
Curated OER
Solar Power
Fifth graders create their own solar panel. They use this experiment to see how the sun can be used as a form of energy.
Curated OER
"Measurement in Motion"
Ninth graders examine the rate of motion and changes in motion using a ramp and a rolling object. They conduct the demonstration, determine the average speed, and describe how a moving object can have zero acceleration and deceleration.
Curated OER
Creating Your Own Rock Art
Fourth graders use regional rock art symbols or their own symbols to cooperatively create a rock art panel. They examine their feelings about rock art vandalism and discuss ways to protect rock art and other archaeological sites.
Curated OER
Download and Analyze
Students download information from a NASA website into a database. They transfer it to a spreadsheet by completing the information and analyze the information. They determine temperature averages, mode, and graph the results. They write...
Curated OER
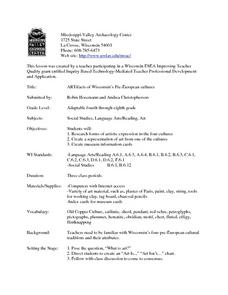
Artifacts of Wisconsin's Pre-european Cultures
Students research forms of artistic expression in four cultures. They create a representation of art from one of the cultures and create museum information cards. They develop a rubric to evaluate each others work.
Alabama Learning Exchange
The Grouchy Ladybug
Students listen to the book, "The Grouchy Ladybug" by Eric Carle and sequence the events in the story. Using a graph, they draw and color the animals that the ladybug meets next to the corresponding time from the story, and conduct...
Curated OER
Step Into My Shoes
Students order their classmates from smallest to largest foot length. In this ordering their classmates from smallest to largest foot length lesson, students trace each of their classmates foot. Students read a story called, 'How Big...
Curated OER
The Human Graph
Students produce a graph of favorite colors. In this graphing lesson plan, students create a human graph based on their favorite color then the teacher transfers the data to a bar graph. Students compare the lines on the graph before...
Curated OER
When is Your Birthday?
Students use data about their birthdays to create graphs. In this collecting and communicating information lesson, students make a class list of their birthdays. Students use the information to make a bar graph showing the information.
Curated OER
Graphing
Learners investigate graphing. In this bar graph lesson, students view an informational website about graphing, then construct a class birthday bar graph outside with sidewalk chalk. Learners choose a survey topic, then collect data and...
Curated OER
Handling Data
Students create a simple table in order to solve a problem. As a class, they create a simple data table in order to discover the number of letters in each student's name. This data is interpreted in order to answer questions and make...
Curated OER
How Long? How Wide?
Second graders distinguish between and use nonstandard and standard units of measurement, use appropriate tools and techniques to measure length and width, and record and interpret data using graphs.
Curated OER
"Dreaming of Success" Unit
Learners recognize the importance of planning for the future. They think about and project themselves into the future. Students become aware that everyone encounters challenges in life and that they can be met and obstacles can be...
Curated OER
Yummy Apples!
Students discuss apples and how they are grown. They listen as the teacher reads "Apples," by Gail Gibbons. Students discuss the story. They view several different types of apples and compare their characteristics. Students taste several...
Curated OER
Black History Project
Third graders explore and analyze about famous African-Americans by listening to four picture book biographies. They generate a list of 15 famous African-Americans and then create a survey to rank them according to importance of...


