Curated OER
Getting to Know You
Students converse with each other while playing a game in order to discover things that are alike and things that are different about themselves. The students gather data about themselves, organize and display data on the graph, and...
Curated OER
Ojibwa Arts
Students create a poem based on the Native American Ojibwa art that they read about. In this Ojibwa art lesson plan, students read captions and look at pictures of Ojibwa art and then make up a poem based on them.
Curated OER
Just Graph It!
Students practice collecting data and organizing it into graphs. As a class, they collect birthday information from each of their classmates. To continue practicing, they examine the characteristics of different bugs and zoo animals. ...
Alabama Learning Exchange
The Very Hungry Class
Students listen to a read aloud of Eric Carle's, The Very Hungry Caterpillar, as an introduction to their study of the metamorphosis of a butterfly. They participate in a number of cross-curricular activities in this unit of lessons.
Curated OER
Graphing Data
First graders learn how to display data using a bar graph. In this bar graph lesson, 1st graders use data from a t-shirt color survey to make a bar graph. They also make an animal bar graph before interpreting the information.
Curated OER
Measuring Snowfall
Students predict the amount of snowfall for the week and measure snowfall. In this measuring snowfall lesson, student use a precipitation gauge to measure the week's snowfall; and analyze the data to determine whether or not...
Curated OER
Let's Graph It! Pre-Test
In this graphing worksheet, students complete a set of 10 multiple choice questions, clicking on a link to see correct answers or print the page.
Alabama Learning Exchange
Meteor or Meteorite
Students differentiate between a meteor and meteorite. They participate in an experiment to discover how the size and weight of an object determines the size of the impact crater. They utilize their math skills by measuring with a ruler...
Curated OER
Tulip Graphing
Students create a graph of tulip growth. In this data analysis lesson, students plant tulip bulbs and use graph paper to begin graphing data on the growth of the tulip.
Alabama Learning Exchange
What's Your Favorite Chocolate Bar?
Learners complete a math survey. In this math graphs lesson, students complete a survey about their favorite candy bars. Learners create different kinds of graphs using Microsoft Excel to show their results.
Curated OER
Tally Time
Students create a tally chart. In this math and health instructional activity, students discuss healthy foods and create a tally chart showing the number of students who like to eat healthy foods.
Curated OER
Plastic Packaging
Students collect data. In this math instructional activity, students collect data about recyclable materials. Students develop a plan that will help the environment. Recycling plastic containers is discussed.
Curated OER
Questionnaires and Analysis
Students, review the techniques and different types of data analysis as well as how they are expressed, identify why facts and data are needed in conclusion of a questionnaire. The concepts of qualitative and quantitative data are...
Curated OER
School Fair
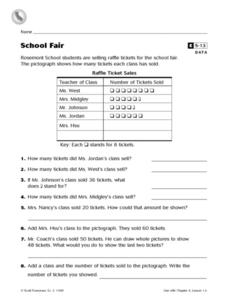
In this data worksheet, students look over a table containing data collected from selling raffle tickets and then answer 8 short answer questions relating to the table.
Curated OER
Use Information in Line, Bar, Circle, and Picture Graphs to Make Comparisons and Predictions
Eighth graders explore the concept of graphs. In this graphs lesson, 8th graders compare and contrast picture graphs, bar graphs, line graphs, and circle graphs. Students examine each type of graph and answer questions and make...
Curated OER
Leap Frog Experiment
Second graders ask questions and design an experiment to explore different spinners in "The Leap Frog" board game. They conduct their experiment, collect information and interpret the results using a graph.
Curated OER
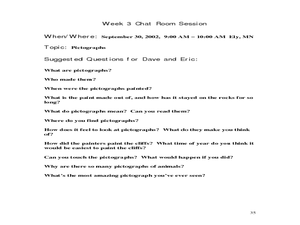
Rock Speaks
Students create primitive forms and caricatures to represent meaningful figures and/or events in their own lives, present their own works to the class, and attempt to interpret the relevant meaning from other students' work.
Curated OER
Party, Party, Party
Second graders conduct investigations with counting, comparing, organizing, analyzing, displaying and interpreting data. They pose questions for investigation and collect the data. Students display the data in tally charts, uniform...
Curated OER
Paper Parachutes
Students participate in a simulation of a parachute-jump competition by making paper parachutes and then dropping them towards a target on the floor. They measure the distance from the point where the paper parachute lands compared to...
Curated OER
Collecting Data
In this data collection worksheet, students read about how data is collected and organized. They also learn about a hypothesis. Students read through examples of different charts and then answer 23 questions pertaining to data...
Curated OER
Skating Data
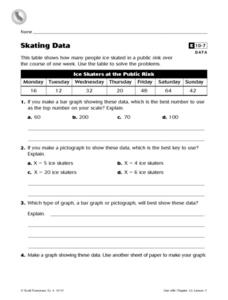
In this collecting data worksheet, 4th graders view a table on ice skaters at a public rink in order to answer 2 multiple choice questions, 1 short answer question and make a graph showing one piece of the data.
Curated OER
Make a Paper Mache Bowl
Students create a paper mache bowl. In this paper mache lesson, students use wallpaper paste, newspapers, and paint brushes to construct a paper mache bowl. Students decorate their bowl with unique designs.
Curated OER
Calendar Communication
Students identify days, dates, and month on a calendar. In this calendar lesson, students use a blank calendar page and fill in the days of the month. Students recall what they learned on specific days and record that information as well.


