Better Lesson
Better Lesson: Greedy Gordy Can't Decide Working With Venn Diagrams
Students have been working with pictographs and bar graphs. Now they take their learning a step further by working with Venn Diagrams.
PBS
Pbs: The Lowdown: Exploring Changing Obesity Rates Through Ratios and Graphs
In these KQED Lowdown infographics, explore how adult obesity rates in the United States, as measured by body mass index (BMI), have dramatically changed in the past half-century. A circular graph and a pictograph depict data by decade,...
National Endowment for the Humanities
Neh: Edsit Ement: Cave Art Discovering Prehistoric Humans
By studying cave paintings, students learn about prehistoric cultures and the stories and ideas they wished to communicate to others through art. The lesson plan presented on this website aims to show young students the significance of...
Teachnology
Teachnology: Survey Teaching Theme
Survey Theme provides an excellent collection of free sample worksheets, teacher resources, lesson plans and interactive media for grades k-12.
Teachnology
Teachnology: Survey Teaching Theme
Survey Theme provides an excellent collection of free sample worksheets, teacher resources, lesson plans and interactive media for grades k-12.
Alabama Learning Exchange
Alex: Great Golly Graphs
This lesson plan asks learners to create a survey project including graphs, questions, tables, and data analysis. It gives an assessment and ideas for remediation and extension as well as ways to manage behavior problems and reluctant...
Beacon Learning Center
Beacon Learning Center: Kinds of Graphs
An interactive web lesson introduces five types of graphs to students and allows them to practice matching the names to examples.
Other
World History Project: Cuneiform
Read a brief history of cuneiform, the most widely used and historically significant writing system of the ancient Middle East. Also learn about how cuneiform spread from one ancient culture to another.
Alabama Learning Exchange
Alex: What's in a Name: Graphing Lesson
A lesson that teaches students how to create and analyze a graph using the letters of their name. The lesson uses the book Chrysanthemum by Kevin Henkes (not included in the lesson plan) to start the discussion.
Louisiana Department of Education
Louisiana Doe: Louisiana Believes: Eureka Math Parent Guide: Collecting and Displaying Data
A guide to support parents as they work with their students in collecting and displaying data.
Louisiana Department of Education
Louisiana Doe: Louisiana Believes: Eureka Math Parent Guide: Problem Solving With Length, Money, and Data
A guide to support parents as they work with their students with problem solving with length, money, and data.
E-learning for Kids
E Learning for Kids: Math: Treasure Island: Interpreting Data
Students will play interactive games to interpret information from different types of graphs.
Curated OER
Photograph: Native Pictographs From British Columbia
European diseases had a catastrophic impact on native culture decimating their population. On this easy to read page, an Ojibwa legend is recalled.
University of Pennsylvania
Penn Library: Walum Olum I
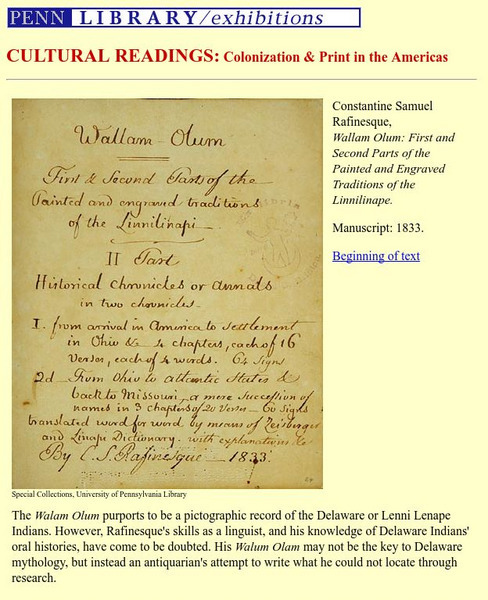
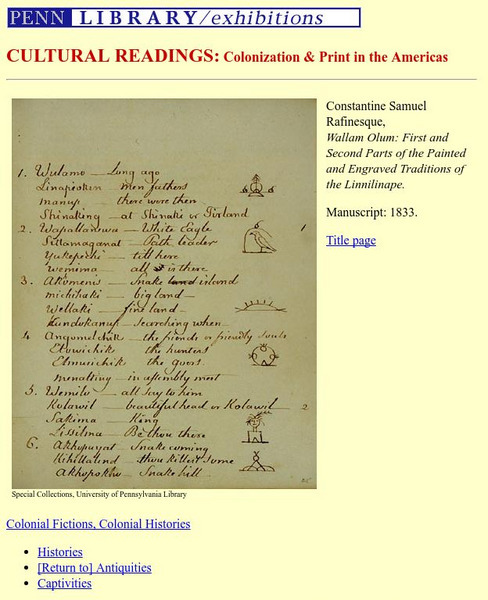
The Walam Olum purports to be a pictographic record of the Delaware or Lenni Lenape Indians. Linked to second page showing the side-by-side pictographs and English translation rendered in 1833.
Stephen Byrne
History for Kids: Ancient Indian Literature
History for Kids teaches us about the literature of ancient India, including the stories of Buddha, epics like Ramayana and Mahabharata, as well as examples of pictographs.
ClassFlow
Class Flow: Graphing Graphs
[Free Registration/Login Required] Standard: Constructs and Interprets simple bar graphs and pictographs with up to 5 columns using whole unit data.
ClassFlow
Class Flow: Graphs
[Free Registration/Login Required] This flipchart presents bar and double bar graphs, line and double line graphs, pictographs, histograms, and circle graphs with review activities and web links for practice.
University of Pennsylvania
Penn Library: Walum Olum Ii
Side-by-side English translation of The Walam Olum, which purports to be a pictographic record of the Delaware or Lenni Lenape Indians.
Primary Resources
Primary Resources: Tally and Bar Charts
Lots of good materials for teaching about tally marks and bar graphs.
Other
The History of Writing
This explanation of the history of writing traces writing from the use of "Counting tokens," to the development of the Roman alphabet. The pictures of how writing has progressed over time is very interesting and helpful.
Curated OER
National Park Service: Gila Cliff Dwellings National Monument
Visit the Gila Cliff Dwellings with the National Park Service and discover the cliff dwellings built and inhabited by the Mimbres, a subgroup of the Mogollon culture.
Alabama Learning Exchange
Alex: You Scream, I Scream, We All Scream for Ice Cream !
Fun and yummy lesson to do on a sunny spring afternoon. Have the students take a poll of their favorite choice of ice cream and create a bar graph showing the information. This lesson plan was created as a result of the Girls Engaged in...
Better Lesson
Better Lesson: Graphing Our Favorite Ice Cream
Third graders can collect and represent data with a unique scale.
Better Lesson
Better Lesson: Class Surveys and Graphs
Students love graphing data that they "own". In this plan, the class will select a type of graph and create it using a class survey frequency table. Included in this activity are videos of the class engaged in the activity and samples of...


