Curated OER
Data Handling: Pictogram of Birds
In this pictograph problem solving worksheet, students analyze a pictograph of birds seen each day for a week. They use the information on the graph to solve 6 problems.
Curated OER
Read a Picture Graph
It's the Bears vs. the Seals! Who is the season winner? Read this data and have your math class answer the six questions that follow. Consider graphing the chart as a class, or encouraging individuals to graph it before answering the...
Curated OER
Pictograph Stone Carving
Students examine pictures of pictograph writing by Native American tribes, and discuss why this method of communication was used. They create their own messages with symbols and drawings on pieces of Styrofoam to simulate rock carvings.
Curated OER
Smarties Pictogram and Bar Chart
In this math learning exercise, students create a bar chart to illustrate the number of Smarties they have in each color. Students also draw a pictogram to represent the same information.
Curated OER
Picturing Hats
In this pictographs worksheet, students examine a pictograph then solve 11 problems related to the data in the pictograph. Students cross out problems that do not relate to the pictograph.
Curated OER
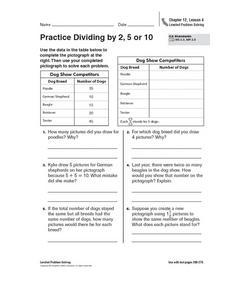
Practice Dividing by 2, 5, or 10
In this pictograph problem solving worksheet, students analyze the data on a table and create a pictograph. Students read and solve 6 story problems about the pictograph.
Curated OER
Picture Fists Full of Kisses
Ease children's back-to-school jitters with this primary grade lesson plan based on the book The Kissing Hand by Ruth E. Harper. Starting off with a singing of the song "I Wish I Had a Little Red Box", children go on to discuss and...
Curated OER
M&M Graphing and Probability
Students sort, classify, and graph M & M's. They create pictographs and bar graphs with the colors and numbers in each bag of M & M's. They calculate the ratio and probability based on class results.
Curated OER
Reading the Neighborhood
First graders complete activities with the story One Monday Morning in the Macmillan/McGraw Hill Textbook. In this data lesson, 1st graders read the story and gather data to create a picture graph. They read the graph and answer...
Curated OER
Birthday Graph
Students explore graphs. In this graphing math lesson, students record the birthdays of each classmate on a data table. Students cut out and add a picture of a birthday cake to a floor or wall pictograph representing the month in which...
Curated OER
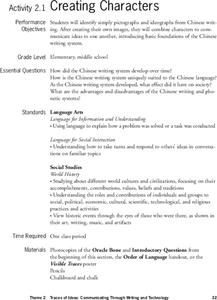
Creating Characters
Learners identify simple pictographs and ideographs from Chinese writing. They create their own images, and combine characters to communicate ideas to one another, introducing basic foundations of how elements of the Chinese writing...
Curated OER
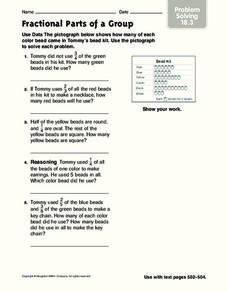
Fractional Parts of a Group
In this problem solving worksheet, students problems solve the answers to 5 mathematical word problems involving fractional parts. Students use data from a pictograph to assist them in solving each word problem.
Curated OER
Talking Rocks
Third graders explain the difference between Petroglyphs and Pictographs from Ancient Native American peoples. They create symbols that are representative of a story about their world.
Curated OER
Talking Rocks
Third graders consider the differences between pictographs and petroglyphs. They create symbols from a story about their worlds. They make pottery art.
Curated OER
One, Two, Three...and They're Off
Students make origami frogs to race. After the race they measure the distance raced, collect the data, enter it into a chart. They then find the mean, median, and mode of the data. Next, students enter this data into Excel at which time...
Curated OER
Take an Ant to Lunch
Second graders construct a model of an ant, exemplifying that ants are insects. Students gather data create a pictograph chart to show ant food preferences. Also, 2nd graders access the Internet to explore ant eating habits.
Curated OER
Probability Using M&M's
Students estimate and then count the number of each color of M&M's in their bag. In this mathematics lesson, students find the experimental probability of selecting each color from the bag. Students create pictographs and bar graphs...
Curated OER
Petroglyphs
Petroglyphs and pictographs are compared in these simple slides. Some of the terms are very specific, but the basic information will be useful to accompany a lecture about this visual art form. Images and real examples would have ben a...
Fuel the Brain
Egg Hunt Pictograph
If you did a hypothetical egg hunt in class, wouldn't it be great to see how many eggs were collected? Your youngsters will receive a list of "collected data" and create a pictograph.
Curated OER
Hats for Sale
What type of hat do you think sells the best? Elementary learners will use the picture graph provided to answer the comprehension questions. A chart accompanies the picture graph, so youngsters can see the data multiple ways.
Curated OER
Easter Egg Pictograph
In this pictograph learning exercise, learners use a given graph to answer questions about Easter eggs found by children and answer related questions. A website reference for additional resources is given.
Curated OER
Dealing with Data
Seventh graders collect and analyze data. In the seventh grade data analysis lesson, 7th graders explore and/or create frequency tables, multiple bar graphs, circle graphs, pictographs, histograms, line plots, stem and leaf plots, and...
Curated OER
Favorite Pet
In this math worksheet, 2nd graders study the pictograph of favorite pets. Students then answer nine questions pertaining to the given graph.
Pennsylvania Department of Education
Freckle Face
Students collect and record data. In this early data analysis lesson, students gather data about their partners face. As a class, the students use tally marks and pictographs to record the data and answer question about the information...


