Curated OER
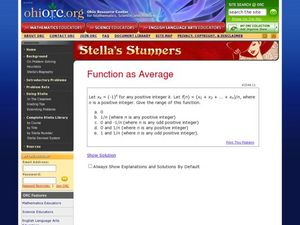
Function as Average
In this secondary mathematics worksheet, students determine the range of the average written as a function. The one page worksheet contains one problem with the solution.
Curated OER
Dog Days or Dog Years?
In need of some algebraic fun with real world implications?Learners use ordered pairs, a table of values and a scatter plot to evaluate the validity of several real world data sets. The class focuses on dog ages in human years, domain,...
Curated OER
Functions Quiz
For this college level algebra worksheet, pupils determine the domain and range of a function, determine the average rate of change given an interval and the function, and graph a polynomial function. The two-page worksheet contains four...
Curated OER
Measure & Evaluate Range, Mean, Median, Mode
Students learn mean, median, and mode through setting up a science experiment. In this measures of central tendency lesson plan, students drop a marble into a box with 2 inches of flour and record the data. Students could also measure...
Curated OER
Finding Range
In this range worksheet, students enter mean, median and mode for sets of number, then enter the range.
Curated OER
Mean, Median, Mode, and Range
For this mean, median, mode, and range worksheet, students find the mean, median, mode, and range of a group of one digit numbers with numbers up to 8. Students complete 6 problems total.
Curated OER
Four-Note Range in Music
Students sing melodic patterns and songs within a four-note range using sol, la, and mi. They echo simple melodic patterns and maintain the tonal center singing two Thanksgiving-related songs, "Hello, hello..." and "Five Fat Turkeys."
Curated OER
Middle Eastern Mountain Ranges Quiz
In this online interactive geography quiz worksheet, students respond to 7 identification questions regarding the mountain ranges of the Middle East.
Shodor Education Foundation
Measures
Take a look at data from a statistical lens. An interactive allows pupils to enter data set, labeling the data including the units used. Manipulating the applet, learners select the statistics to calculate that include total, mean,...
Georgia Department of Education
Math Class
Young analysts use real (provided) data from a class's test scores to practice using statistical tools. Not only do learners calculate measures of center and spread (including mean, median, deviation, and IQ range), but also use this...
Shmoop
Box, Stem-Leaf, and Histogram
A helpful and versatile worksheet requires young mathematicians to analyze data in order to create graphs and answer questions. Additionally, it prompts learners to find the mean, median, mode, and range of some of the data sets.
EngageNY
Secant and the Co-Functions
Turn your class upside down as they explore the reciprocal functions. Scholars use the unit circle to develop the definition of the secant and cosecant functions. They analyze the domain, range, and end behavior of each function.
Curriculum Corner
Measures of Central Tendency
Reinforce the concept of central tendency—mean, median, mode, and range—with a practice packet that comprises of eight problems and a structured answer sheet with plenty of room to show work.
Teacher's Corner
Brandon's Baseball Collection
Ten questions make up a worksheet that challenges baseball enthusiasts to read a graph then answer questions pertaining to the data's range, mean, median, and mode.
Education Development Center
Creating Data Sets from Statistical Measures
Explore the measures of central tendency through a challenging task. Given values for the mean, median, mode, and range, collaborative groups create a set of data that would produce those values. They then critique other answers and...
Howard Hughes Medical Institute
Spreadsheet Tutorial 2: Autofill Data, Cell References, and Standard Deviation
If you've always wanted to know more about spreadsheets, here's a perfect resource for you. A self-paced tutorial introduces how to autofill and copy formulas in a Google sheet or Excel spreadsheet. It also shows users how to find range,...
CCSS Math Activities
Baseball Players
Statistics is an important part of baseball. Given the mean weight of players on a baseball team, scholars determine the total weight of the players. They then find the median and range of weights for the opposing team. Lastly, they...
Curated OER
Determining Mean, Range, Median, Mode, and Probability
Students calculate mean, median, range, mode and probability. Then, working in teams, they use data from their workplace to compute values for these terms. Finally the class explores the term "probability" using a die.
Curated OER
“Home on the Range”
Fourth graders analyze the song "Home on the Range" and identify its meaning and setting. For this timeline and retelling lesson, 4th graders use dictionaries to find definitions of unfamiliar words, create a timeline and retell the...
Curated OER
Domain and Range
In this domain and range worksheet, students solve and complete 5 different sets of problems. First, they find the domain and range of each of the given functions. Then, students determine whether each of the functions is odd, even or...
Curated OER
Reading: No Home on the Range
In this poetry analysis instructional activity, students read a poem called "No Home on the Range" by LaVonne Houlton. Students answer 8 multiple choice questions about the poem.
Math Mammoth
Stem-and-Leaf Plots 3
In this stem-and-leaf instructional activity, students place statistical data in a stem-and-leaf plot. They identify the median, and range in a given set of data. There are four multi-step problems on this one-page instructional activity.
Curated OER
Using Matrices for Data
In this matrices for data learning exercise, 9th graders solve and complete 29 various types of problems that include using matrices to illustrate data. First, they determine the sum, difference and scalar product for each matrices...
Curated OER
Analyzing Data Sets
In this analyzing data sets worksheet, 11th graders solve and complete 35 various types of problems that include the analysis of data given. First, they determine the equation that best describes the data shown in a table. Then, students...


