Curated OER
Transformations and Rotations
Students define and identify transformation and rotation. In this geometry lesson, students define rotations as congruence or isometry. They find the coordinates of an image and pre-image.
Curated OER
Probability and Geometry
Learners explore the ways Geometry can help solve probability problems. Students describe platonic solids and practice calculating probability using an online resource. They construct dice with various numbers of sides to demonstrate...
Curated OER
The Tangent Ratio
Students calculate the tangent ratio given a right triangle. In this trigonometry instructional activity, students use a right triangle and the Pythagorean Theorem to solve problems.
Curated OER
Trigometric Ratios
This lesson requires a worksheet that is not connected. It is integral to the lesson.
Curated OER
Similarity and Congruence
Young scholars determine that two figures are similar or congruent by
investigating figures that are similar and figures that are congruent. They prove that two figures are similar or congruent by using definitions,
postulates, and...
Curated OER
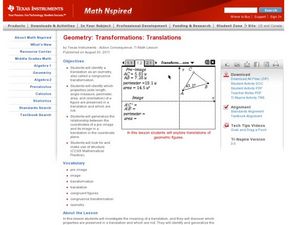
Transformations: Translations
Students perform transformations and translations using polygons. In this geometry instructional activity, students perform transformations on a coordinate plane. They identify the image and pre-image of each figure.
Curated OER
Making a Circle Graph of a Sample Budget
Students examine a sample budget and categorize the entries as a group. Then in small groups they convert budget category totals to percents and degrees to make a circle graph related to a sample budget.
Curated OER
Surface Area of Prisms
Students compute surface area and volume of prisms. In this surface area lesson plan, students find the surface area and volume of rectangular and triangular prisms. Independently, students use their computers to determine the volume,...
Curated OER
Surface Area and Volume
Students are introduced to the notion of surface area and volume, learn the terminology used with surface area and volume and have experimented with the surface area and volume of different prisms.
Curated OER
Navigating by the Numbers
Students observe how math is important in navigation and engineering. They study how surveyors use math and science to calcute, count, measure, label, and indicate distances on a map. They estimate specific distances.
Texas Instruments
REAL LIFE REAL WORLD Activity - Surveyor
Learners investigate surveying in this secondary mathematics lesson. They will explore a real world application of geometry and trigonometry as they create a plot plan using a geometry utility and calculate the area of the land parcel.
Curated OER
How Fast Is Your Car?
Eighth graders discover the relationship between speed, distance, and time. They calculate speed and represent their data graphically. They, in groups, design a ramp for their matchbox car. The goal is to see who's ramp produces the...
Curated OER
Graphing
Students collect data to create different types of graphs-line, pie, and bar graphs. They use StarOffice 6.0 to create graphs.
Curated OER
Scatter Plots
Seventh graders investigate how to make and set up a scatter plot. In this statistics lesson, 7th graders collect data and plot it. They analyze their data and discuss their results.
Curated OER
Creating Parallelogram
Learning how to define vocabulary words related to solving parallelograms will assist your learners in identifying different parallelograms. They use the navigator to view different shapes created by moving the parallelogram around.
Curated OER
Introduction to Fractals: Infinity, Self-Similarity and Recursion.
This instructional activity introduces young scholars to the ideas involved in understanding fractals. They develop a sense of infinity, self-similarity and recursion and
Curated OER
Introduction to Fractals: Geometric Fractals
Students study and observe the patterns made by the areas of the Sierpinski Triangle. Students use the computer to draw two or three iterations to discover the number patterns. Students complete worksheets based on Geometric Fractals.
Curated OER
Geometric Fractals and the Chaos Game
Students define fractals and patterns. They explore how a seemingly random process can result in a pattern. Students practice probability and fractions skills by playing the chaos game online.
Curated OER
Trig is SOH Easy!
Young scholars derive the six trigonometric identities. In this trigonometry lesson plan, students review the parts of a right triangle and use the Pythagorean theorem as a guide to find the trig identities. They find sine, cosine and...
Curated OER
Algebra/Geometry Institute: Area of Polygons
Students find the area of polygons. In this area of polygons lesson, students find the area of parallelograms, rectangles, squares, and other polygons. They identify each given figure and determine the appropriate formula...
Curated OER
Radians, Arc Length, and the Area of a Sector
In this college level geometry worksheet, students convert between degrees and radians. Students determine arc length and solve problems involving the area of a sector. The four page worksheet contains seventy-four...
Curated OER
SAS Similarity Theorem
Students identify and use the similarity theorem. In this geometry lesson, students differentiate between congruent and similar triangles. They solve problems using the computer modifying shapes by dragging.
Curated OER
Exploring Trigonometric Ratios
Learners identify the ratios of trig functions. In this trigonometry lesson, students construct triangles and use it to derive the values of sine, cosine and tangent. They use Cabri software to create the visual of the identities.
Curated OER
Tessellations
Learners create tessellations. In this geometry lesson, students use polygons to create different patterns by rotation. They identify the reasons for polygons to create the type of tessellation it does.


