Curated OER
Animals Belong in Class
In this classifying animals worksheet, students use the information in the word bank to complete the T-Chart about mammals, birds, fish, reptiles, amphibians, and arthropods. Students write 10 answers.
Curated OER
Introductory Bacteria and Virus Worksheet
Compare and contrast eukaryotes, prokaryotes, and viruses with a chart and a Venn diagram. Beginning microbiologists consider motility, reproductive ability, DNA content, and the presence of organelles. They write short answers to...
Curated OER
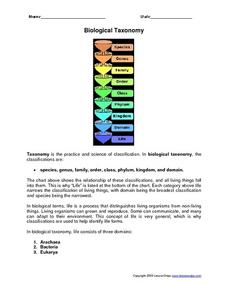
Biological Taxonomy
In this biology learning exercise, students read about biological taxonomy. They then use the information they learned to answer the 13 questions on the learning exercise. The answers are on the last page of the packet.
Curated OER
Using a Flow Chart for Classification
In this flow chart learning exercise, students learn to use flow charts for classification of numbers, geometric shapes and animals. Students follow the directions and fill out flow charts to work out 20 answers. This is an online...
Curated OER
Science – How Living Things are Grouped
In this classification of living things worksheet, students respond to 7 short answer, 10 true or false, 4 multiple choice, and 4 graphic organizer questions regarding how living things are grouped.
Curated OER
Invertebrate Diversity
Comparative anatomy prevails in the lesson exploring diversity among invertebrates. Biologists examine physical characteristics of an earthworm from phylum annelida and a meal worm from phylum insecta. They also inspect a cricket and a...
Curated OER
What Kind of Animal Are You?
With the descriptions of six different animal groups (amphibians, birds, fish, insects, mammals, reptiles), learners match different examples of animals to their proper groups (lizard to reptiles, girl to mammals, etc). The activity...
Curated OER
Mammals And Reptiles
In this animal worksheet, 3rd graders study the aspects of the different animal classifications of mammals vs. reptiles. Students cut out 8 animals and paste them on the chart in the correct category.


