Curated OER
Mathematics Within: Bar And Pie Graphs
Students compare and contrast the use of bar and pie graphs with the same data. They create a data set by surveying all students in the class using sticky notes to make a table on the board. Then, each student creates a bar and pie graph...
Curated OER
Geometric Relatioships
Students explore measurements and geometric formulas. In this geometry lesson, students investigate pi as it relates to geometry. They collect data and use a chart to organize the data.
Curated OER
Probability: The Study of Chance
Students practice the basic principles of probability by conducting an experiment, determining if a game is fair, collecting data, interpreting data, displaying data, conducting analysis, and stating and applying the rule for probability.
Curated OER
Transportation Through Time
Third graders measure the speed at which they can walk in order to understand speed and distance traveled. They then research the history of transportation and express data in a class timeline.
Curated OER
Probability
Students investigate probability. For this fourth through sixth grade mathematics lesson, students collect, organize and display data in an appropriate chart or graph as they calculate and apply basic probability.
Curated OER
What Are The Chances
Students calculate the probability of an event occurring. In this probability lesson, students differentiate between independent, dependent or compound events. They find the range of the data.
Curated OER
Rolling Down Hill
Students perform an experiment, collect, and analyze data of a rolling marble down a ramp. They report results after they complete their experiment. Students are assessed in science and writing.
Curated OER
Crustal Sinking
Students measure the rate of sinking of a test tube into a beaker of "glop", representing a model of the interaction between the Earth's crust and upper mantle. This task assesses students' abilities to make simple observations,...
Curated OER
Pie Graph
Fifth graders examine fractional parts of pie graphs. Given a bag of M&Ms, 5th graders interpret the data. They use a paper plate and colors to create a graph of the types of M&Ms represented.
Curated OER
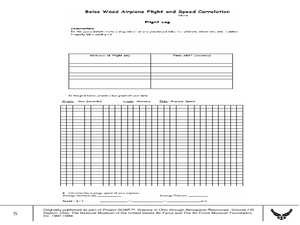
Balsa Wood Airplane Flight and Speed Correlation
Ninth graders calculate the average speed of their balsa wood airplane. For this physics lesson, 9th graders build their own airplane and make necessary modifications to to make it fly straight. They interpret distance and time graph...
Curated OER
Starch and Sugar Testing 1
Eighth graders determine the presence of starch and sugar in unknown solutions. This task assesses students' abilities to observe, record and interpret data, classify, generalize/infer, construct data tables, and identify sugar and...
Curated OER
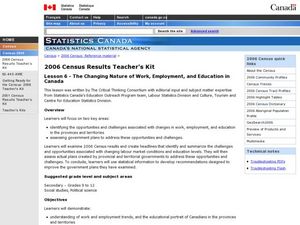
The Changing Nature of Work, Employment, and Education in Canada.
High schoolers identify the effect caused by change of employment and education. In this statistics lesson, students analyze data and draw conclusions. This assignment tests high schoolers' ability to use data correctly.
Curated OER
Technology Literacy Challenge Grant Learning Unit
First graders explore counting and classification. They sort leaves, create graphs, write sentences for the data in the graphs, develop graphs for shapes, favorite animals, birthdays, and participate in a die prediction game.
Curated OER
Density of Minerals
Students determine the mass, volume, and density of two different mineral samples. Students show data and calculations as well as answer questions about the mineral identities.
Curated OER
Sizing Pumpkins
Fifth graders study the sizes of pumpkins. They measure and record the diameters of pumpkins. They create five subtraction problems and solve them. They weigh their pumpkins, record the data and select two pumpkins to make a graph of...
Curated OER
A Thanksgiving Survey
Students take a survey then use the information gained from the survey to help plan a typical Thanksgiving dinner for our last day of class. They create a graph which corresponds the the data gathered during interviews.
Curated OER
Planet Research and Brochure
Fourth graders design a brochure based on the planet that they researched. In this planets lesson plan, 4th graders include the data, important facts, and completed as a team.
Curated OER
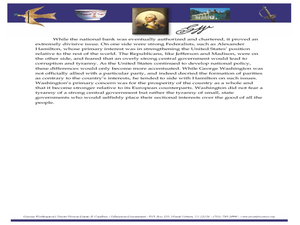
Using Political Cartoons to Understand Historical Events
Examine historical perspectives through the use of political cartoons. Learners complete analysis activities related to the president's title, the establishment of the national bank, and the Jay Treaty.
Discovery Education
It's Too Loud!
STEM scholars investigate sound attenuation by conducting an experiment in which they compare the farthest distance that they can hear a sound with and without ear protection.
Curated OER
M & M Madness
Second graders graph M & M's by color. In this graphing lesson plan, 2nd graders first predict how many of each color they think are in a handful of M & M's. Then they graph the amounts of each color on a computer program....
Curated OER
A Thanksgiving Survey
Students conduct a survey. In this math lesson, students design and conduct a survey about Thanksgiving foods. Students display the collected data in a graph and use the graph to determine what food to serve for a Thanksgiving meal.
Curated OER
I'm Nobody Bio Poem
Eighth graders analyze Emily Dickinson's poem, I'm Nobody. After discussing it, they create their own bio poem. They draw and label mandalas and display them in class.
Curated OER
Pizza Possibilities
Middle schoolers create and interpret line plots, bar graphs, and circle graphs. The lesson assumes mastery of conversions from fraction to decimal to percent, construction of angles, and at least an introduction to graphs displaying data.
Curated OER
Who's On First?
Have you ever considered why the number 10 is so important to us? That's what learners do here. They explore patterns formed by powers of ten and by decimals, convert units of measure within the metric system, and express these in the...


