Curated OER
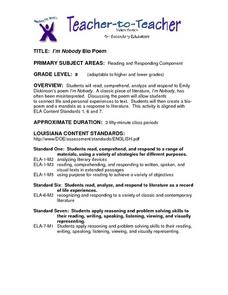
I'm Nobody Bio Poem
Eighth graders analyze Emily Dickinson's poem, I'm Nobody. After discussing it, they create their own bio poem. They draw and label mandalas and display them in class.
Curated OER
Pizza Possibilities
Middle schoolers create and interpret line plots, bar graphs, and circle graphs. The lesson assumes mastery of conversions from fraction to decimal to percent, construction of angles, and at least an introduction to graphs displaying data.
Curated OER
Who's On First?
Have you ever considered why the number 10 is so important to us? That's what learners do here. They explore patterns formed by powers of ten and by decimals, convert units of measure within the metric system, and express these in the...
Curated OER
Virtual Field Trip
Learners calculate gasoline cost per mile on a virtual field trip. They calculate the gasoline costs and travel time for each of the 2 routes, and record on a data sheet. They use Excel to create data tables for mileage, gasoline...
Curated OER
Math & Social Science
Students are given data and are to calculate averages and yearly totals of how many cars travel the Tacoma Narrows Bridge. They also make a graph of the data.
Curated OER
Ya' Gotta Have Heart
Fourth graders study the parts of the human circulatory system and how they function. They design a flow chart of the circulatory system and use data to construct charts and graphs.
Curated OER
It's Your Choice
Students compare data and determine the appropriate way to organize the data. They use physical graphs, pictographs, and symbolic graphs to display their data. In addition, they complete a Venn diagram.
Curated OER
Lesson Plan for Fontana Mines
Students estimate and compute with rational numbers. They compare, order and convert among fractions, decimals and percents. Students analyze problems to determine if there is sufficient or extraneous data to solve.
Curated OER
Timed Multiplication Test Graphs
Students use the tools of data analysis for managing information. They solve problems by generating, collecting, organizing, displaying histograms on bar graphs, circle graphs, line graphs, pictographs and charts. Students determine...
Curated OER
Food Ways - Graphing
Sixth graders choose the appropriate graph to display collected data. They interview each other on what foods they eat. They also interview elders and find out what types of food they grew up eating. They create graphs to display the...
Curated OER
Spreadsheets in Science
Fourth graders create spreadsheets, explore patterns and make predictions based on the information. They select the appropriate graph to display the spreadsheet data. They search and sort prepared data bases to gain knowledge for...
Curated OER
Math Lesson: How Many People Live There?
Students are able to calculate the population density of a country, and calculate the population density of large cities in that country. They are able to create an appropriate graph to represent their data for that country.
Curated OER
Twelve Days of Christmas
Learners create charts and graphs using a spreadsheet. They chart the number of each gift given day by day from the song, "The Twelve Days of Christmas." They create a bar graph and a circle graph from their data on the spreadsheet.
Curated OER
Heads-Up Probability
Second graders use tree diagrams to predict the possible outcomes of coin tosses. The data they collect and graph also help them predict the likelihood of getting heads or tails when tossing coins the next time.
Curated OER
Listen to Your Heart
Sixth graders explore how exercise affects heart rate and use spreadsheets to record and analyze data.
Curated OER
Mapping My Community
Ninth graders are introduced to GPS technology. They complete fieldwork as they visit a specific area of their community to identify and map types of land use in the surveyed area. They use the collected data to create a digital map.
Curated OER
What is a Cloud
Third graders study clouds and how they are formed. They write acrostic poems about clouds and analyze and graph temperature data collected during varying degrees of cloud cover.
Curated OER
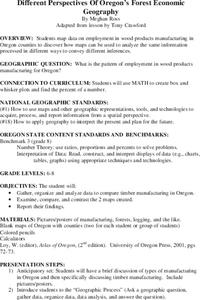
Different Perspectives of Oregon's Forest Economic Geography
Students locate the many forests located in Oregon. In groups, they use the internet to research employment data on wood products made in the state. They discuss how looking at information presented in a different way can change their...
Curated OER
Pictograph to Bar Graph
Second graders explore organizing data to make it useful for interpreting picture graphs and bar graphs. They use Graphers software to create a pictograph and a bar graph.
Curated OER
Discovering a Law of Space Physics
Learners use data collected by an astronomer to determine the relationship between the time it takes the planet to orbit the sun and the average radius of the planet's orbit around the sun. Students use trial and error to find the...
Curated OER
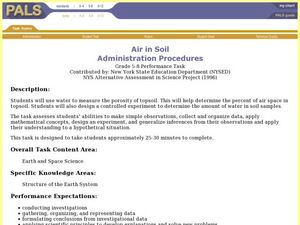
Air in Soil Administration Procedures
Students study soil and its composition. In this soil composition lesson, students study examples of soil during several days of aeration. Students summarize their data, organize it, and must be able to explain their findings.
Curated OER
Lift vs. Airspeed
Young scholars, after reading the explanation given below, use FoilSim and a graphing calculator to complete the activity to determine the relationship between airspeed and lift of an object by interpreting data.
Curated OER
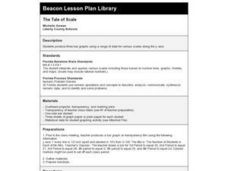
The Tale of Scale
Eighth graders, using a range of data, produce three bar graphs for various scales along the y-axis.


