Curated OER
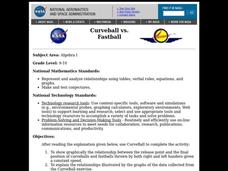
Curveball vs. Fastball
Students graph the relationship between the release point and the final position of curveballs and fastballs thrown by both right and left handers given a constant speed, and explain the relationships illustrated by the graphs of data.
Curated OER
Discovering the Structure of the Atom
Students investigate atomic and nuclear structure of matter by researching historical atomic theories. Students examine Rutherford's studies and discover that many scientific conclusions change over time as new data is collected.
Curated OER
Bar Graphs Using M & Ms
Fifth graders observe an overhead of a graph on which M & Ms have been poured out. A volunteer comes up and separates the colors writing on the overhead how many there were of each color and another person labels the graph's title....
Curated OER
Graphing
Learners collect data to create different types of graphs-line, pie, and bar graphs. They use StarOffice 6.0 to create graphs.
Curated OER
Percents: What's the Use
Learners research percentages in real world situations. In this percents lesson, students demonstrate their ability to apply percents to everyday situations. Learners communicate mathematically by conducting interviews about percents and...
Curated OER
Regions of the United States
Fifth graders collect data about regions of the United States using the Internet, library books, and encyclopedias. They write an essay persuading people to visit their state.
Curated OER
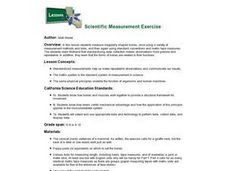
Scientific Measurement Exercise
Students measure irregularly shaped bones, once using a variety of measurement methods and tools, and then again using standard conventions and metric tape measures. They explore firsthand that standardizing data collection makes...
Curated OER
T-Shirt Lettering
Learners determine the cost of a t-shirt using a variety of mathematical operations to solve problems. Then they use a spreadsheet to calculate the cost of lettering a t-shirt and display this information in a graph.
Curated OER
Our Zoo Friends
First graders plan and create a model zoo depicting the natural habitats of animals. Their models include animals and a display of written factual information about the animals. Students present their project by conductig a tour of...
Curated OER
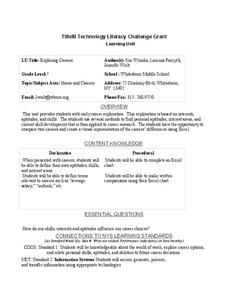
Exploring Careers
Seventh graders investigate their career aptitudes and interests through a scavenger hunt. They display their choices in Excel spreadsheets.
Curated OER
Using the TI-GRAPH LINK
Students investigate the use of the TI-Graph Link. In this middle school mathematics instructional activity, students explore the transfer of data from the TI-73 to the computer and vice-versa using the TI-Graph Link.
Curated OER
Convection Currents
Students explain and understand the circulation of air in the atmosphere. They identify that energy can be carried from one place to another by heat flow or by waves, including water, light and sound waves, or by moving objects. ...
Curated OER
Tallahassee Project
Sixth graders gather information from technological sources such as TV, radio, and Internet as well as from newspapers and maps and produce a final printed report. They use the data to create a spreadsheet and read a Florida state...
Curated OER
Weather... Or Not
Students observe and discuss the local weather patterns, researching cloud types and weather patterns for cities on the same latitude on the Internet. They record the data for 6-8 weeks on a graph, and make weather predictions for their...
Center for Learning in Action
Density
Explore the concept of density within states of matter—gases, liquids, and solids—through a group experiment in which young scientists test objects' texture, color, weight, size, and ability to sink or float.
Curated OER
Friction Force
High schoolers investigate friction force on a variety of objects such as bricks and cardboard boxes. They use a force probe to collect data on the changes in force required to drag the objects across a variety of surface types.
Curated OER
Publishing a Book Review
Pairs use desktop publishing software, as well as digital video and camera equipment, to craft a book review. These reviews are then shared with others in the school community through the class or school website.
Curated OER
Finding PI
Students select and use appropriate operations, methods and tools to compute or estimate using whole numbers. They develop and use formulas for determining the circumference and area of circles. Students determine and describe the...
Curated OER
Education for Global Peace
Students survey the class and graph the results. In this graphing and data collection lesson, students conduct a survey to see where their shirts were produced. Individuals use software to graph the results and create a written...
Curated OER
Ecosystems
Students create plots of land in three different ecosystems and use AppleWorks to collect data for research. This lesson includes a downloadable worksheet and can be accomplished in four days.
Curated OER
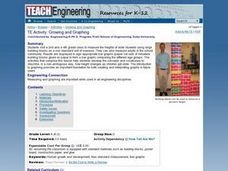
Growing and Graphing
Students visit a 2nd and a 4th grade class to measure the heights of older students using large building blocks as a non-standard unit of measure. They can also measure adults in the school community. Results are displayed in...
Curated OER
Graphing Valentine Candies
Fifth graders organize and display information in bar graph form using appropriate labels. Each student receives a box of Valentine heart candies, a worksheet of the tally chart and a worksheet of the bar graph.
Curated OER
Finding Mean, Mode and Median in the Computer Lab
Students create spreadsheets which will display and figure mean, median, and mode of a set of numbers.
Curated OER
Favorite Foods at Thanksgiving
Fourth graders study different types of graphs as a means of displaying information. They survey others to find their favorite Thanksgiving food and then graph the results using different types of graphs.


