Curated OER
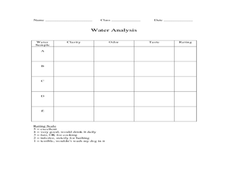
Is Our Water Healthy?
Students test water for a least one chemical characteristic. They hypothesize how a storm event might change the chemical characteristics of a stream. Students collect water samples and use the chemical test to test the water.
Curated OER
Aquatic Ecosystem Exploration
Students visit a local stream, pond, creek, or river and collect macroinvertebrates. They sort macroinvertebrates and identify each species using a dichotomous key. Students decide on trophic levels and construct a possible food web for...
Curated OER
What If There's No Light?
students discuss the importance of light and the consequences of living without it. Using a plant as a demonstration, students predict and observe what happens to a plant when it does not receive enough light. In groups, they experiment...
Curated OER
Runoff: Intro to Watersheds
Learners are taught that a watershed is, what types of basic land cover are impermeable and permeable to water. They trace the flow of water around their school and around their home. Students determine what watershed their school is a...
Curated OER
Invasives and Marsh Birds
Students are taught that invasive plant removal can have a variety of impacts. They are shown this by using graphs. Students view maps of vegetation change on Iona Island. They discuss implications of changes on marsh birds using data...
Curated OER
Water Chestnut Graphing Activity
Students are taught how to format and enter data into an Excel spreadsheet. They make a graph and interpret graphed data. Students discuss possible impacts of water chestnut invasion. They graph data on water chestnut. Students report...
Curated OER
Water Quality with Samples
Students recognize whether one wants to drink water, swim in it, or for the health of the organisms living in it. They prepare different water samples to observe and collect samples regarding the water quality.
Curated OER
Bottled Water vs. Tap Water
Young scholars analyze the similarities and differences between tap water and bottled water. They make informed decisions about their use of each. Students are asked if they drink mostly tap water straight from the tap or water fountain....
Curated OER
Land Use Change Introduction
Pupils discuss the major changes that have taken place in the Hudson Valley over the past 400 years. They use aerial photos to describe major trends in Dutchess County. Students view a PowerPoint presentation. They work in small groups...
Curated OER
Hudson Valley Rocks
Students identify each of the rocks provided and locate where in the valley they are found. They explain why the rocks came to be as they are in each location. In addition, they relate the exercise to how the Hudson Valley's geologic...
Curated OER
Glacial Groundwater
Learners study glacial deposition and groundwater in Dutchess County, new York. They identify the permeability rates in different glacial deposits and relate this information to ground water capacity of sediments found in Dutchess...
Curated OER
How Much Water is in That River?
Students practice measurement using the Hudson River. They calculate the discharge measurement at a location on the Hudson River using ingenuity and a topographic map.
Curated OER
Environmental Issues And Energy Alternatives Crossword
In this environmental issues worksheet, students solve 16 clues focusing on the forms of renewable and non-renewable energy, global warming and acid rain.
Curated OER
Seasons and Cloud Cover, Are They Related?
Students use NASA satellite data to see cloud cover over Africa. In this seasons activity students access data and import it into Excel.
Virginia Department of Education
Hurricanes: An Environmental Concern
Hurricanes, typhoons, and tropical cyclones are the same type of storm, but their names change based on where they happen. Scholars use a computer simulation to learn about hurricanes. Then they hypothesize ideas to prevent hurricanes...
Curated OER
What is a greenhouse?
Students experiment to gain understanding of how a greenhouse retains heat. For this greenhouse lesson, students work with soda bottles and simulate a greenhouse. Students compare data from a vented and intact bottle. Students...
Curated OER
Paper Makers
Students make recycled paper out of scrap paper, water, and leaves. In this natural resources lesson plan, students learn about conservation of the forest and how we can use recycled paper to fuel our paper supply.
Curated OER
Hurricane Frequency and Intensity
Students examine hurricanes. In this web-based meteorology instructional activity, students study the relationship between ocean temperature and hurricane intensity. They differentiate between intensity and frequency of hurricanes.
Curated OER
Ocean Currents and Sea Surface Temperature
Young scholars use satellite data to explore sea surface temperature. They explore the relationship between the rotation of the Earth, the path of ocean current and air pressure centers. After studying maps of sea surface temperature and...
Curated OER
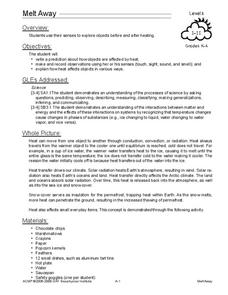
Melt Away
Students explore objects before and after heating using their senses. In this matter and energy instructional activity, students experiment with a variety of objects and use their senses (except taste) to make predictions and...
Curated OER
Seasonal Cloud Cover Variations
Students, in groups, access data from the NASA website Live Access Server regarding seasonal cloud coverage and the type of clouds that make up the coverage. They graph the data and make correlations between types, seasons and percentages.
Curated OER
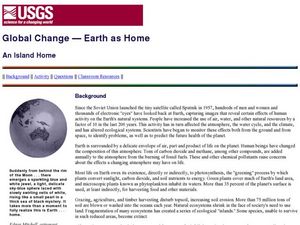
Global Change- Earth as Home
Students create their own environment. In this environmental protection lesson, students pretend they are the owners of a tropical island. They create jobs for the citizens and develop the island as a model environment.
Curated OER
Phytoplankton and Ocean Color
Fifth graders identify function of phytoplankton in the biospere by conducting experiments and simulations and reading for information. They detect the presence of phytoplankton in bodies of water by examining ocean in satellite images...
Curated OER
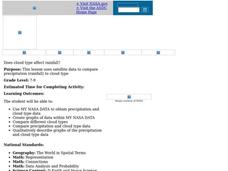
Does Cloud Type Affect Rainfall?
Student uses MY NASA DATA to obtain precipitation and cloud type data. They create graphs of data within MY NASA DATA. They compare different cloud types as well as precipitation types. They describe graphs of the precipitation and cloud...


