Curated OER
Classification of Clouds
High schoolers view a cloud slide show presentation and identify types of clouds. They estimate height based on cloud's appearance. They discuss the vague nature of cloud nomenclature and compare it to the English standard measurement...
Curated OER
Creating Station Models
Students work in groups to interpret weather maps. They use latitude and longitude readings to complete a worksheet together and turn in the worksheet along with the maps and a rubric.
Curated OER
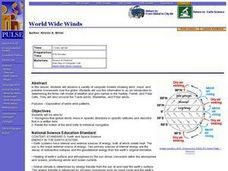
World Wide Winds
High schoolers recognize that global winds move in specific directions in specific latitudes and describe that in a written form. They relate the motion of the wind belts to historical navigation.
Curated OER
Winds Go Spinning Around
Students simulate the Coriolis Effect to comprehend why winds in the Westerlies are prone to cyclonic and anti-cyclonic motion. They arrive at an explanation of processes that drive world wind patterns
Curated OER
Tanker Spills
Students predict the flow of an oil spill and depict it on a map. They explain the predicted route of the oil spill using knowledge of ocean currents in a short presentation to their peers.
Curated OER
Trouble in the Troposphere
Students Use data sets from MY NASA DATA to produce graphs comparing monthly and yearly ozone averages of several U.S. cities. They analyze and evaluate the data and predict trends based on the data. In addition, they discuss and...
Curated OER
Science: What Is the Carbon Cycle?
Students examine the carbon cycle while identifying its sources, sinks, and release agents. Using magazines and newspapers, groups of students design collages illustrating the carbon cycle. Finally, they write responses to several...
Curated OER
Tropical Atlantic Aerosols
Young scholars analyze NASA data from the Multi-angle Imaging Spectroradiometer. In this NASA data lesson, students access an assigned website to examine information from the MISR on the Terra Satellite. They determine how desert dust...
Curated OER
Trouble in the Troposphere
Students create graphs using NASA data, compare ozone levels of several U.S. cities, analyze and evaluate the data and predict trends based on the data, and discuss and describe how human activities have modified Earth's air quality.
Curated OER
Global Winds
Pupils extend their understanding of convection to consider global winds and the effect of the earth's rotation on the creation of patterns of prevailing wind direction.
Curated OER
Does Humidity Affect Cloud Formation?
Students use NASA's S'COOL database to identify factors that affect cloud formation.
Curated OER
Seasonal Cloud Cover Variations
Students recognize different cloud types. They determine the seaonality of various types of clouds. They graph the data and determine if a correlation exists between season, cloud cover and type of clouds most prevalent during each season.
Curated OER
Formation of Rain
Students sequence the steps leading to the formation of rain, and design a model to represent these steps. This task assesses students' abilities to classify, generalize, infer, interpret and communicate data, and construct a pictorial...
Curated OER
Observing and Predicting Weather from a Weather Station
Fourth graders us a Weather Log data chart to record the date, time, day, and weather. They discuss different instruments and charts needed to record the information. Students turn in their weather logs at the end of two weeks and...
Curated OER
Acid Rain
High schoolers use real-time weather maps to determine the likelihood of acid rainfall in a region. Students apply their understanding of interaction between weather systems, land and air pollution, to address acid rain and the effects...
Curated OER
Driving Currents
Learners conduct a variety of investigations to see how water, heat, and salinity affect the flow of the world's ocean currents,as well as, explore many factors that affect the flow of the world's ocean currents. They also describe in...
Curated OER
Trends of Snow Cover and Temperature in Alaska
Students compare NASA satellite data observations with student surface measurements of snow cover and temperature. They practice data collection, data correlations, and making scientific predictions.
Curated OER
Carbon for the World
Students explore the presence of carbon in the world. In this environmental stewardship lesson, students discuss the carbon cycle after they read assigned textbook pages. Students also discuss biomass content in different parts of the...
Curated OER
Acid and Rain and Its Effects
Young scholars work in groups for up to three weeks to investigate the possibility of acid rain in your area and to investigate the damage that acid rain can do to buildings, monuments, and plants. Each group prepares a report to local...
Curated OER
The Rainforest Community
Students create a miniature rainforest ecosystem, a terrarium. Students then explain how the continuous flow of energy and food in the ecosystem allows it to sustain itself.
Curated OER
Defining Drought
Students examine the hydrologic impacts of drought. They look at drought from a variety of prespectives. Students first focus on the scientific definition of drought, including weather patterns, water cycles, water requirements by plants...
Curated OER
What is Drought?
Students explore and conduct an experiment on the effects of drought on the environment. They define what drought is and the impact that a shortage of rainfall can have on agriculture, municipal water supplies, tourism, recreation, etc.
Curated OER
Science Quizzes: Weather Quiz
In this weather science quiz worksheet, students respond to 20 short answer and true or false questions regarding weather and extreme weather.
Curated OER
Bats and Hot Dogs
Students identify patterns and relationships from data that is collected and solve variables. In this investigative lesson students study ocean productivity, the nitrogen cycle and phytoplankton then answer questions.


