Curated OER
Pictures of Data
In this data worksheet, students look at maps and charts and answer multiple choice questions about them. Students complete 10 questions.
Curated OER
Pond Theme Unit
For this pond theme worksheet students research facts on pond life. Students complete comprehension questions, crosswords, word search, and math puzzles. Students write a short report.
Curated OER
Multiple Intelligences Survey
In this multiple intelligences worksheet, students complete a survey asking them about different ways they like to learn. Students complete 24 questions. This should be a very enjoyable activity for students.
Curated OER
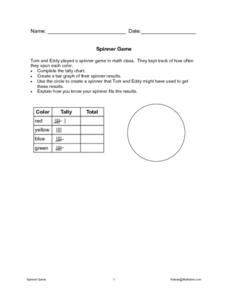
Math Spinner Game
In this math game activity, students complete a tally chart by filling in the "total" column of a graphic organizer. Students then create a spinner that might have been used to get the results shown and then explain how they know the...
Government of Alberta
Learn Alberta: Math Interactives: Exploring Data Display and Graphs
This multimedia Learn Alberta math resource focuses on graphing data. In the video portion, students will see how math is involved in the display of merchandise in stores. The accompanying interactive component provides an exploration...
Other
Tulpehocken Area School District: Graphing and Analyzing Scientific Data
Student worksheet with explanation of pie, bar, and line graphs, the parts of a graph, and the definition of mean, median, and mode. This summary is followed by an exercise for each type of graph within a scientific context.
Government of Alberta
Learn Alberta: Math Interactives: Exploring Election Data
Using actual Alberta provincial election results, students have the opportunity to interpret election data using a variety of graph types. Pictographs, line graphs, bar graphs, circle graphs, and data tables are covered in this...


