Curated OER
Inequalitities Mixed Review
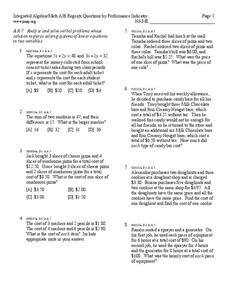
Students solve inequalities and graph it on a number line. For this algebra lesson, students rewrite word problems into algebraic equations and graph it using compound inequalities.
Curated OER
After the Garbage Can: Where Does Our Trash Go?
Learners explore how waste disposal has changed over time and what the current issues are. In this disposal instructional activity students collect data and create graphs.
Curated OER
How Strong is Your Magnet?
Students measure the strength of a magnet and graph how the strength changes as the distance from the magnet increases.
Curated OER
Plant a Seed of Kindness
Students perform acts of kindness. In this character lesson, students cut out seed shapes and write down their acts of kindness on them. Students place the seeds on a bulletin board where they "plant" them below the grass line.
Curated OER
Sports Data for the Classroom
In this algebra worksheet,students rewrite word problems using algebraic expressions. They collect data and plot their findings on the graph and analyze it. There is an answer key for this worksheet.
Curated OER
So Fast! So Slow!
Fifth graders give examples of objects that move slow and fast. In this physics lesson, 5th graders rank animals according to how quickly they move. They create a bar graph of organisms versus rates of speed.
Curated OER
Crunching the Numbers on Dating Violence
Students read about potential violent relationships and beliefs about dating. In this relationship lesson plan students use graphs to examine data about healthy realtionshipsand draw conclusions on their results.
Curated OER
Front Page News
Students write original earthquake articles typically found on the front page of a newspaper. Each student has the freedom to write in a variety of writing styles (lead story, human interest story, editorials, etc.). They research...
Curated OER
Understanding Absolute Values
Learners solve absolute value problems, In this algebra activity, students discuss distance as they relate it to absolute values. They distinguish between negative and positive numbers inside of an absolute value bars and how the answer...
Curated OER
Linear Equations
In this algebra activity, students solve linear equations and graph their answer. They add and subtract integers and compare them using a number line. There are 15 questions with an answer key.
Curated OER
Linking Real World Data to the Classroom
Students analyze data representing real life scenarios.In this algebra lesson, students collect, plot and analyze data using a graph. They use different methods to represent and present their data.
Curated OER
Make a Frequency Table and a Histogram for a Given Set of Data
In this data recording and data organization worksheet, students create one frequency table and one histogram for a given list of data. Explanations and examples for frequency tables and histograms are given.
Center for Math and Science Education
Solar System Launch
Trying to understand the vastness of outer space can be quite a challenge for young scientists. Help put things in perspective with this cross-curricular activity as students work in pairs creating scaled models of the solar system,...
Georgia Department of Education
Math Class
Young analysts use real (provided) data from a class's test scores to practice using statistical tools. Not only do learners calculate measures of center and spread (including mean, median, deviation, and IQ range), but also use this...
Code.org
Making Data Visualizations
Relax ... now visualize the data. Introduce pupils to creating charts from a single data set. Using chart tools included in spreadsheet programs class members create data visualizations that display data. The activity encourages...
Math Learning Center
Fourth Grade Assessments and Scoring Checklists, Common Core State Standards
Find out how your class is progressing in math with a set of assessments. Learners finish a baseline assignment to assess where they are beginning the year and then work on tests with increasing difficulty as the year progresses.
Curated OER
Can you Find the Expression
Students collect data from measurements and weights for this experiment. In this algebra lesson, students analyze graphs they create form their data to find the expression representing the data. They label which graph provided the best...
Curated OER
Positive Future Fair Project
Ninth graders view the film "Pay It Forward" and discuss what kind of public campaign is needed to move people to positive action. They consider different ways of presenting information (graphs, visual displays, etc.) as tools for...
Curated OER
Writing Linear Equations
In this math worksheet, learners write the equations in slope intercept form for the equations that are graphed. They also create equations using slope and intercepts.
Curated OER
Leap Frog Experiment
Second graders ask questions and design an experiment to explore different spinners in "The Leap Frog" board game. They conduct their experiment, collect information and interpret the results using a graph.
Curated OER
Keep It Cool
Pupils complete a science experiment to study insulation, heat transfer, and permafrost. In this permafrost study lesson, students design and test a soda insulator. Pupils graph their class data and discuss the results. Students discuss...
Curated OER
Preventing Forest Fires (Elementary)
Students complete activities to learn about the importance of fire prevention and protecting the diversity of the forest. In this forest protection lesson, students discuss forest fires and work in groups to research the species count in...
Curated OER
Testing Battery Combinations
Fourth graders examine the required combinations of plates and predict which combination will generate the most and least current and voltage. They use an ammeter and experiment with combinations of their own testing and record each...
Curated OER
Mathematical Models with Applications: The Sounds of Music
Pupils use an electronic data-collection device to model the sound produced by a guitar string. They identify the graph of a periodic situation and use the graph to determine the period and frequency of sound waves.
Other popular searches
- Line Pie Bar Graph
- Line/bar Graph
- Line and Bar Graphs
- Line Bar and Circle Graphs
- Line Graph Bar Graph
- Line, Bar, and Circle Graphs
- Line, Bar and Circle Graphs
- Double Bar Line Graphs


