Curated OER
Plastic Packaging
Students collect data. In this math instructional activity, students collect data about recyclable materials. Students develop a plan that will help the environment. Recycling plastic containers is discussed.
Curated OER
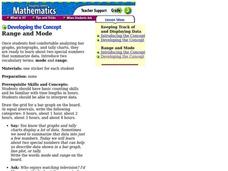
Range and Mode
Fifth graders interpret data. In this mode and range lesson plan, 5th graders define mode and range and practice finding them given a set of data.
Curated OER
Classification Introduction
Students simulate classifying rocks using different colored skittles. In this earth science activity, students create a Venn diagram according to their compiled information. They share this diagram in the class.
Curated OER
Candy is Dandy
Students investigate color distribution in bags of M&Ms They sort and classify the contents of a bag of M&Ms and summarize their findings on a worksheet. Students convert the numbers into charts and make predictions about color...
Curated OER
Questionnaires and Analysis
Students, review the techniques and different types of data analysis as well as how they are expressed, identify why facts and data are needed in conclusion of a questionnaire. The concepts of qualitative and quantitative data are...
Curated OER
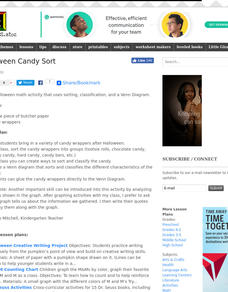
Halloween Candy Sort
Students use their Halloween candy to practice sorting and classifying. They compete a Venn diagram comparing their candy wrappers. They develop ways as a class to catorgize the candy in different ways.
Curated OER
Helicopter Design Company
Students test different designs of helicopters to determine what of the four designs will fall the slowest. In this helicopter lesson students complete an activity and fill out their worksheet.
Curated OER
A Statistical Look at Jewish History
Students complete their examination over the Jewish Diaspora. Using population figures, they discover the importance of percentages in exploring trends. They use their own ethnic group and determine how it is represented in the United...
Curated OER
Travel Mug Design
Learners create and develop a travel mug. They create visuals and a three dimensional infomercial. They apply an engineering design and demonstrate knowledge of thermodynamics involved in heat transfer. They illustrate Newton's Law of...
Curated OER
Seashore Sweep
Young scholars gather information about sea animals. For this ocean lesson, students read a story about the ocean and seashore. They discuss the needs of seashore animals and create a Mystery Ocean Animal riddle book. Young scholars...
Curated OER
Potential and Kinetic Energy
Sixth graders explore potential and kinetic energy. In this science lesson plan, 6th graders assume the role of a roller coaster engineer and design a roller coaster. Students use their knowledge of kinetic and potential energy to design...
Curated OER
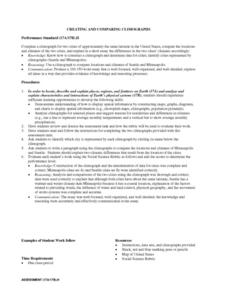
Creating and Comparing Climographs
Students are introduced to the importance and usefulness of climographs. In groups, they create a climograph of two cities on about the same latitude. They compare and contrast the locations and climates of the two cities and write a...
Curated OER
Comparison of Two Different Gender Sports Teams - Part 1 of 3 Measures of Central Tendency
Students gather and analyze data from sports teams. In this measures of central tendency lesson, students gather information from websites about sports team performance. Students analyze and draw conclusions from this data. This lesson...
Curated OER
Which Tape is Stickiest?
Students conduct an experiment to determine which style of tape will stick the best. In this controlled experiment lesson, students predict which tape will stick best to a marble that rolls over it, then they conduct the experiment and...
Curated OER
Stock Reports
Learners spend $10,000 by picking up to 3 stocks in which to invest. They monitor their progress for three weeks, and chart results in a spreadsheet template.
Curated OER
Math Vocabulary
In this math worksheet, students examine the vocabulary terms and use them for review of the curricular goals or objectives. The sheet gives a review activity in the form of a crossword puzzle.
Curated OER
Phenomenal Weather-Related Statistics
Eighth graders research, collect and interpret data about weather statistics. They record that data on spreadsheets. they create Powerpoint presentations on their individual or group research.
Curated OER
Rolling Records
Fourth graders play a game to determine the likelihoods of different outcomes when rolling two number cubes. Students play a game to determine the likelihoods of different outcomes when rolling two number cubes.
Curated OER
Weather Patterns
Students use yearly averages over a five-year period to understand weather trends for a specific area.
Curated OER
Thank You... Thomas Edison!
Pupils investigate the life of Thomas Edison. They research how he made a difference. They understand that accurate data collection is important for math. They create a chart using spreadsheet data.
Curated OER
Mother May I?
Third graders measure distance using nonstandard units of measure. In this measurement lesson, 3rd graders measure a given distance through the use of the game "Mother May I?" Student gather and compare data on how many "giant steps" and...
Curated OER
Age Structure Studies
Students collect data from Internet sources to compare age distributions in their city, county or state with that of other places in the US or other countries. They construct and interpret age-structure population pyramids and research...
Curated OER
Student Weather Journal
Students recognize different types of cloud patterns and associate these patterns with certain types of weather. They predict the weather for the next 6 to 24 hours. They then improve their observation skills as they check on the weather...
Other popular searches
- Line Pie Bar Graph
- Line/bar Graph
- Line and Bar Graphs
- Line Bar and Circle Graphs
- Line Graph Bar Graph
- Line, Bar, and Circle Graphs
- Line, Bar and Circle Graphs
- Double Bar Line Graphs


