Curated OER
Veggie Chop and Data Analysis
First graders chop vegetables into fractions. In this fractions lesson, 1st graders cut vegetables, collect data about favorite vegetables and create a bar graph using the information. Students make inferences about the data and...
Curated OER
Statistics and Probablility
Statistics and Probability are all about collecting, organizing, and interpreting data. Young learners use previously collected data and construct a picture graph of the data on poster board. This stellar lesson should lead to...
Curated OER
Food for Class Party
In this interpreting a bar graph and math word problems worksheet, 2nd graders read the information about choices of food for a class party and answer various multiple choice questions. Students solve 25 problems.
Curated OER
ABC...Have Fun With Me!
Throw out those old ABC worksheets and try some new and engaging hands-on activities to teaching the alphabet!
Science 4 Inquiry
Journey Through the Spheres of the Earth
Each of the Earth's spheres interacts with the other spheres in predictable ways. Young scientists explore these interactions through a hands-on activity, graphing, and watching a video. They summarize their knowledge in a video or...
Curated OER
Smarties Pictogram and Bar Chart
In this math instructional activity, learners create a bar chart to illustrate the number of Smarties they have in each color. Students also draw a pictogram to represent the same information.
Curated OER
Tulip Graphing
Young scholars create a graph of tulip growth. In this data analysis lesson, students plant tulip bulbs and use graph paper to begin graphing data on the growth of the tulip.
Curated OER
Jellybean Graphs
Second graders predict and graph data based on the color of jelly beans they think are in a handful. In this prediction lesson plan, 2nd graders will predict how many of each color jellybean are in a handful. Then they graph these...
Curated OER
Using Data From a Graph
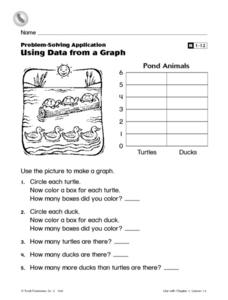
In this graphing instructional activity, students create a bar graph with information from a picture of some pond animals. Students answer 5 questions about the graph.
Curated OER
Where Do I Fit on the Graph?
Young scholars collect data and create graphs about themselves, their community, and the world around them. They use a variety of methods to organize data, such as stickers, clothespins, name tags, coloring, tally marks, etc.
Curated OER
THE EASTER BUNNY GETS READY! PICTURE GRAPH
In this graphing instructional activity, students read a picture graph about colors of Easter eggs and then answer questions about the graph.
Curated OER
Graphing with the Five Senses
Students collect data and record it on a bar graph. In this data graphing lesson, each small group of students is assigned to collect data on one of the five senses. They then practice a song that helps them remember the purpose of each...
National Security Agency
Starting a Restaurant
Through an engaging unit, chefs-in-training will sort and classify data using tally charts. Learners will also create bar graphs to display restaurant data and interpret data from bar graphs using a variety of categories....
California Education Partners
Colorful Data
Scale up your lessons with a performance task. Young data analysts work through an assessment task on scaled bar graphs. They answer questions about a given scaled bar graph on favorite colors, analyze a bar graph to see if it matches...
Curated OER
Growing a Seed
Seeing how seeds grow into plants is such an enjoyable for young scholars! They plant lima bean seeds and take pictures to record the growth of their plants. Students write in a journal to describe their daily observations of their...
Curated OER
Graphing Fun
First graders analyze objects and make a graphing picture to analyze the data. In this graphing lesson, 1st graders complete an object graph assessment, a picture graph assessment, and a bar graph assessment to analyze their given objects.
Curated OER
Fast Food Survey Using Bar Graphs
Second graders conduct survey and sort data according to categories, construct bar graph with intervals of 1, and write a few sentences about their graphs.
Curated OER
Graphing Data
Second graders examine how to make and read bar graphs. In this bar graph lesson, 2nd graders compare bar graphs to pictographs by looking at hair color survey data. They practice making a bar graph and finding the range of the data.
Curated OER
Use a Graph Reteach 4.8
In this graph instructional activity, students solve 3 problems using a data table and bar graph. Students write number sentences to figure out answers to the questions about kinds of toys in a shop.
Curated OER
Graph and Compare the Adventure's Temperature Vs. Local Temperature
Students explore the concept graphing data. In this graphing data instructional activity, students use weather data from their local weather and some other city and graph them. Students plot the local weather vs. another city. Students...
Curated OER
Go The Distance Car Construction
Students build and program a car to drive a specific challenge distance.They must at the end of the instructional activity, have the car that stops the closest to a challenge distance.
Learner
Solid Shapes
A collection of two lessons, kindergartners will identify two-dimensional shapes in solid shapes. They will develop basic knowledge of the components that make up a sphere, rectangular prism, pyramid, cylinder, cone, and cube. Young...
101 Questions
Deodorant
Smells like learning! Young scholars collect data on the length of time a stick of deodorant lasts. After modeling the data with a graph and function, they make predictions about deodorant use over time.
Curated OER
Show Me!
Young scholars analyze and interpret graphs. In this graphing lesson, students view a video and construct their own graphs (line, circle, bar) from given sets of data.


