Curated OER
Understanding Statistics
In this statistics worksheet, students examine and interpret pictographs and line graphs. Students analyze the provided data in order to create bar graphs, circle graphs, and box and whisker plots. The nine page worksheet accompanies a...
Curated OER
Learning To Read Graphs
In this graph reading activity, students write how many kids like various drinks shown in a graph.
Curated OER
John's Trucking- Who Drove the Farthest
In this graph worksheet, students analyze a triple bar graph showing miles driven by three truck drivers. Students use the graph to fill out a chart with total miles driven by each driver.
Curated OER
Misleading Statistics
In this misleading statistics worksheet, students identify misleading graphs. They determine the mean, median and mode of given data. Students determine the measure of central tendency which accurately describes the data. This one-page...
Curated OER
Our Pets
In this graphing worksheet, students survey their classmates about what pets they like. Students record the data in the form of a bar graph. There are 8 choices listed.
Curated OER
E3 Practice Assessment - Pets
In this assessment worksheet, 3rd graders complete eight pages of math assessment. Students solve problems related to money and a bar graph. Students solve word problems involving rounding and computation.
Curated OER
Do You Live in The Country Or in the City?
In this math worksheet, students participate in a group graphing project. Students survey classmates about where they live and plot the results on a bar graph.
Curated OER
How Many Buttons Do You Have Today?-- Classroom Graph
In this math worksheet, students collaborate as a class to record information about how many buttons each student has on any one day. Students plot the data on a bar graph.
Curated OER
It's Freezing!
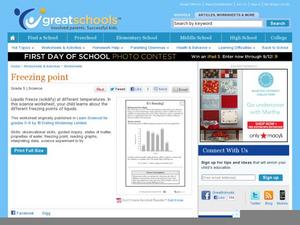
Here is a good activity for 5th grade scientists. In it, they look at a bar graph that shows the freezing point for a variety of liquids. Then, they are given a scenario of a certain liquid melting and freezing, and must determine which...
Curated OER
Probability: What's Most Likely?
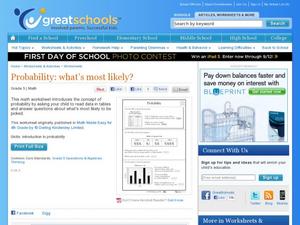
Work with graphs, tally marks, and probability. Fifth graders read tables with different sets of data, including tally marks and a bar graph, to answer five questions. Use this activity as part of a probability lesson, or as a homework...
Curated OER
Fractions: pie graphs, numbers, and bars
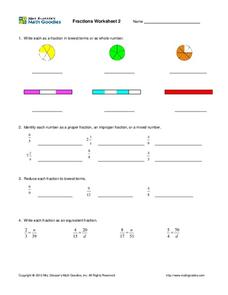
In this fraction worksheet, middle schoolers complete fraction problems containing pie graphs, numbers, bars, proper fractions, lowest terms, and more. Students complete 19 problems.
Curated OER
Mr. Brown's Pet Store
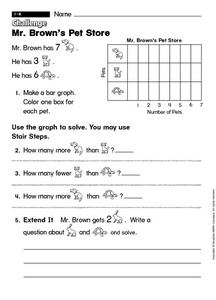
For this early childhood problem solving worksheet, students make a bar graph with the provided information and then use the graph to solve 4 problems.
Curated OER
U.S. Beach Attendance
In this bar graphs instructional activity, students analyze the information about beach attendance over a period of 5 years. Students solve 3 story problems about the graph.
Curated OER
7th Science Quiz
This seventh grade life science quiz has a professional appearance and well-written multiple-choice questions. However, it seems to cover too broad a variety of biology topics for only 15 questions to fully assess. There is one question...
Georgia Department of Education
The Basketball Star
Have learners use math to prove they are sports stars! Assess a pupil's ability to create and analyze data using a variety of graphs. The class will be motivated by the association of math and basketball data.
Curated OER
Do You Like Hamburgers Or Hot Dogs Better?-- Class Bar Graph
In this math worksheet, students collaborate to complete a bar graph. Students are surveyed as to their preference for hot dogs or hamburgers. Results are plotted on a bar graph.
Curated OER
If It Were Raining, Would You Rather Play Indoors Or Outside?-- Class Bar Graph
In this math instructional activity, students collaborate as a class to complete a bar graph. Students survey classmates as to their preferences in where they like to play. Data is plotted on the bar graph.
Curated OER
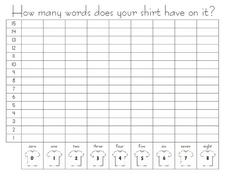
How Many Word Does Your Shirt Have on It? --class Bar Graph
In this math worksheet, students participate in a group bar graph activity. Students survey classmates about how many words, if any, are on their shirts. Results are plotted on a bar graph.
Curated OER
How Old Are You? -- Class Bar Graph
In this math worksheet, students participate in a group bar graph activity. Students survey their classmates about their ages and plot the results on this graph. Choices given are 5,6,7 or 8.
Curated OER
When is Your Animal Most Active?-- Class Bar Graph
In this science and math worksheet, a group of students participate in graphing what time of day their chosen animals are most active. Students fill out the bar graph choosing day or night.
Curated OER
Which Vegetable Do You Like To Eat the Most?-- Class Bar Graph
In this math activity, students participate in a group graphing activity. Students are surveyed on favorite vegetables and the results are plotted on a bar graph.
Curated OER
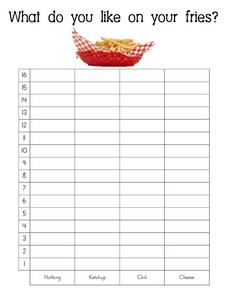
What Do You Like on Your Fries?-- Class Bar Graph
In this math worksheet, students participate in a group graphing activity. Students are surveyed about what they like on their fries: nothing, ketchup, chili or cheese. Results are plotted on a bar graph.
Curated OER
What Kind of Movies Do You Like To Watch?-- Class Bar Graph
In this math instructional activity, students collaborate in collecting data and displaying it on a class bar graph. Students indicate which type of movies they like and plot the information on the graph.
Curated OER
How Many Pockets Do You Have Today?--class Bar Graph
In this math worksheet, learners complete a class bar graph. Students survey classmates as to how many pockets they have today and plot the data on the graph.
Other popular searches
- Skittles Bar Graph
- Double Bar Graphs
- Bar Graphs Pictographs
- Histogram and Bar Graph
- Bar Graphs and Histograms
- Bar Graph Problem Solving
- Favorite Food Bar Graph
- Bar Graphs Histograms
- Interpreting Bar Graphs
- Bar Graphs for Birthdays
- Bar Graph Worksheet
- Bar Graphs and Charts


