Curated OER
Which of These Animals Have You Ridden Before?-- Class Bar Graph
In this math worksheet, students collaborate to make a bar graph. Students survey classmates as to which animal they have ridden before: elephant, horse, llama, ostrich or camel. Results are plotted on a graph.
Curated OER
How Many Vowels Are in Your Name?-- Class Bar Graph
In this language arts/math activity, students collaborate to make a group graph. Students survey classmates about how many vowels are in names. Results are plotted on a bar graph.
Curated OER
Data Analysis Challenge
In this data analysis worksheet, young scholars work with a partner to collect information for a survey. The information is then compiled into a graph. Students must indicate their survey question, the target audience, predict the...
Curated OER
Graphs
In this graphing worksheet, 6th graders name the place that is at the coordinates given to them of this graph of the city. Students complete 8 problems.
Curated OER
How Many Legs Does Your Animal Have?-- Class Graph
For this science and math worksheet, learners plot information about their chosen animal on a bar graph. Students indicate how many legs their animal has. This appears to be intended for a large group of learners in comparing animals.
Curated OER
Review For Test 3
In this test worksheet, students interpret circle graphs, bar graphs, and line graphs. They match graphs to their appropriate linear equation. Students determine the slope of a line. There are 20 problems on this six page worksheet. ...
Curated OER
Graphing Activity
In this probability and statistics worksheet, students work with a family member to construct graphs based on real life data. The two page worksheet contains three questions. Answers are not included.
Curated OER
Unit VII: Worksheet 4 - Energy
Energize your physics class with this energy exercise! Physics learners solve seven problems in which they calculate speed, velocity, or energy values for a variety of situations. This is a suitable homework assignment for high school...
Curated OER
Petro Products
In this petroleum products learning exercise, students are given the components of crude oil and they graph the various products found in a 50 gallon barrel. Students complete an activity to determine if they have collected cards that...
Curated OER
Sorting Sweethearts
In this holiday worksheet, students estimate how many heart candies are in a cup. Then, students sort their hearts and add up how many are in each color and how many there are total. Students also create a bar graph that displays how...
Curated OER
What Is A Rate? Practice Sheet
Your mathematicians practice expressing rates with ratios. They identify from among 12 ratios the ones that are unit rates. They express six given situations as two equal rates each. Finally, they interpret data about fuel efficiency...
Bridges In Mathematics
Grade 2 Comprehensive Growth Assessment
Need to know if your students comprehend all the Common Core standards covered in second grade? This growth assessment will let you know. Find out if your second graders can add/subtract, tell the time, read a bar graph, know their...
Living Rainforest
Finding the Rainforests
From Brazil to Indonesia, young scientists investigate the geography and climate of the world's tropical rain forests with this collection of worksheets.
Curated OER
Groovin' News Activity Sheet
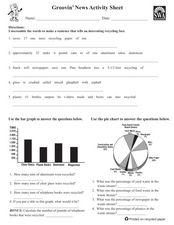
In these recycling worksheets, students complete several activities to learn about recycling. Students complete a word search, word scramble, bar graph, pie chart, research project, class project, and individual project for recycling.
Curated OER
Collecting Data
In this data collection worksheet, students read about how data is collected and organized. They also learn about a hypothesis. Students read through examples of different charts and then answer 23 questions pertaining to data...
Curated OER
Interpreting Graphs: Temperate Climates
For this interpreting graphs worksheet, students read a graph containing data of rainfall and temperature, then complete 18 questions, interpreting the data.
Curated OER
Freshman Project-Part 5
In this project instructional activity, 9th graders display their data, the make a graph and they answer analysis and conclusion questions on their experimental design project. They discuss the variables of their experiment, their major...
Curated OER
Graphs
In this Cartesian coordinate plane worksheet, students analyze 4 ordered pairs and locate the place that goes with that point on a graph. Students also write the ordered pair for 4 places shown on the graph. Note: One of the places is a...
Curated OER
Using Data To Make Graphs
In this using data to make graphs worksheet, students interactively answer 10 multiple choice questions then click to check their answers.
Charleston School District
Review Unit 4: Linear Functions
It's time to show what they know! An assessment review concludes a five-part series about linear functions. It covers all concepts featured throughout the unit, including linear equations, graphs, tables, and problem solving.
Curated OER
Fractions of Whole Numbers 1
In this math worksheet, students use line graphs and fraction bars to multiply fractions and whole numbers. The fraction is represented on the line graph and the whole number on the fraction bar.
Curated OER
How Many?
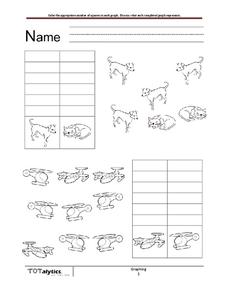
How many cats are there? Dogs? As learners examine a set of images, they fill in a chart to indicate how many of each image there are. In the first series, there are four dogs and two cats. In the second, there are three planes and six...
Curated OER
Favorite Food Graph (Blank)
In this math worksheet, students create a bar graph to display the results of "your Favorite Food Survey." The graph is not labeled but has spaces for all the choices.
Curated OER
Chapter 7 Word Search
In this statistics worksheet, students locate and identify various vocabulary terms related to mathematics and statistics. There are seven words located in the puzzle to find.
Other popular searches
- Skittles Bar Graph
- Double Bar Graphs
- Bar Graphs Pictographs
- Histogram and Bar Graph
- Bar Graphs and Histograms
- Bar Graph Problem Solving
- Favorite Food Bar Graph
- Bar Graphs Histograms
- Interpreting Bar Graphs
- Bar Graphs for Birthdays
- Bar Graph Worksheet
- Bar Graphs and Charts


